


 User Center
 My Training Class
 Feedback


The trade value of China’s exports to Europe increased by 12.6% year-on-year in May
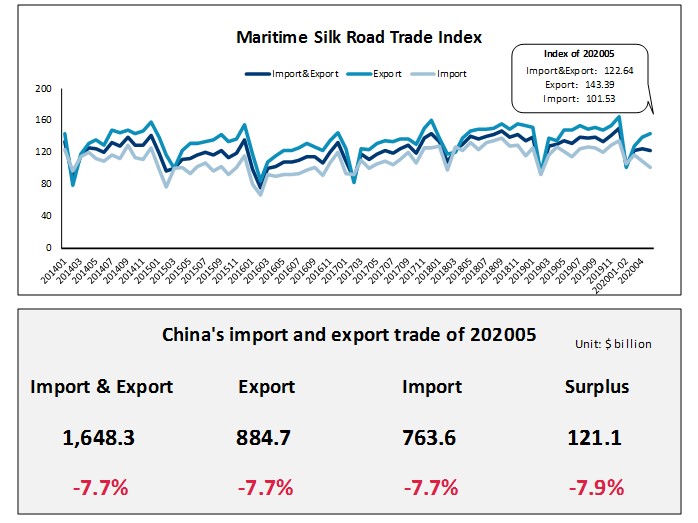
In May 2020, the Maritime Silk Road Trade Index (STI) released by the Ningbo Shipping Exchange showed that the import and export trade index was 122.64 points, down 1.26% from the previous month and down 9.15% year-on-year; the export trade index was 143.39 points, up 3.27% from the previous month , A year-on-year decrease of 3.29%; the import trade index was 101.53 points, a decrease of 7.12% month-on-month and a year-on-year decrease of 16.44%. From January to May, my country’s total import and export trade was 1,648.266 billion US dollars, a year-on-year decrease of 7.72%. Total export trade was US$884.674 billion, down 7.73% year-on-year; total import trade was US$763.592 billion, down 7.71% year-on-year.
From January to May, the import and export trade value between China and Asia was 866.563 billion US dollars, a year-on-year decrease of 5.61%, accounting for 52.57% of China’s total imports and exports. The export trade value was 439.308 billion US dollars, down 6.38% year-on-year; the import trade value was 427.525 billion US dollars, down 4.80% year-on-year.
From January to May, the import and export trade value between China and Europe was US$320.11 billion, a year-on-year decrease of 7.66%, accounting for 19.42% of China’s total imports and exports. The export trade value was US$182.748 billion, down 5.35% year-on-year; the import trade value was US$137.364 billion, down 10.57% year-on-year.
From January to May, the import and export trade value between China and Africa was US$67.994 billion, down 19.56% year-on-year, accounting for 4.13% of China’s total imports and exports. The export trade value was 38.913 billion US dollars, down 10.66% year-on-year; the import trade value was 29.081 billion US dollars, down 29.02% year-on-year.
From January to May, the import and export trade value between China and North America was US$204.264 billion, down 13.80% year-on-year, accounting for 12.39% of China’s total imports and exports. The export trade value was 150.04 billion US dollars, down 13.97% year-on-year; the import trade value was 54.224 billion US dollars, down 13.35% year-on-year.
From January to May, the import and export trade value between China and Latin America was 113.140 billion US dollars, a year-on-year decrease of 8.31%, accounting for 6.86% of China’s total imports and exports. The export trade value was 51.36 billion US dollars, down 9.76% year-on-year; the import trade value was 61.78 billion US dollars, down 7.07% year-on-year.
From January to May, the import and export trade value between my country and Oceania reached US$76.046 billion, up 0.06% year-on-year, and accounted for 4.61% of my country’s total imports and exports. The export trade volume was US$22.576 billion, up 3.03% year-on-year; the import trade volume was US$53.471 billion, down 1.14% year-on-year


Comments
Something to say?
Log in or Sign up for free