


 User Center
 My Training Class
 Feedback


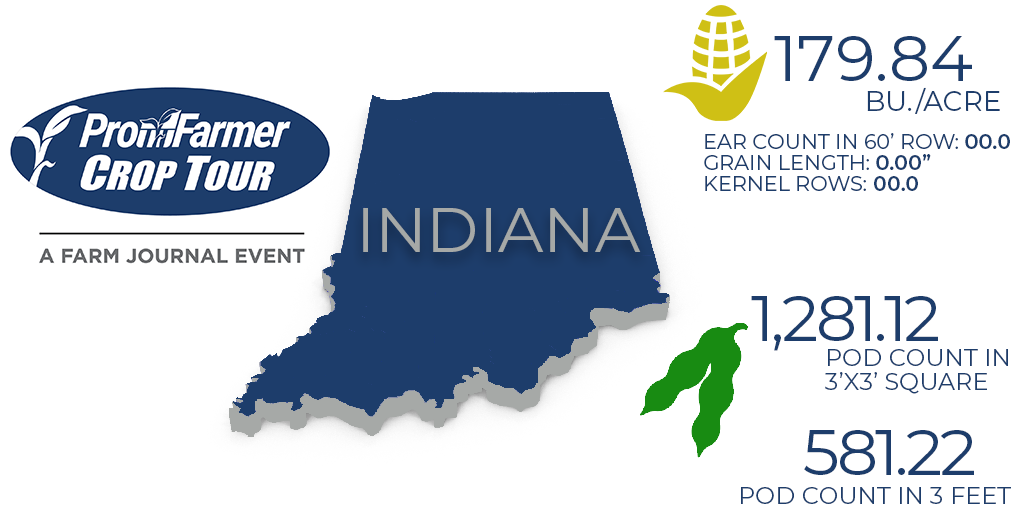
Despite some apparent variability, Indiana corn and soybeans are shaping up to be impressive crops. Indiana’s final estimates for corn leapt 4.75% while soybeans increased 12.89% over their three-year averages.
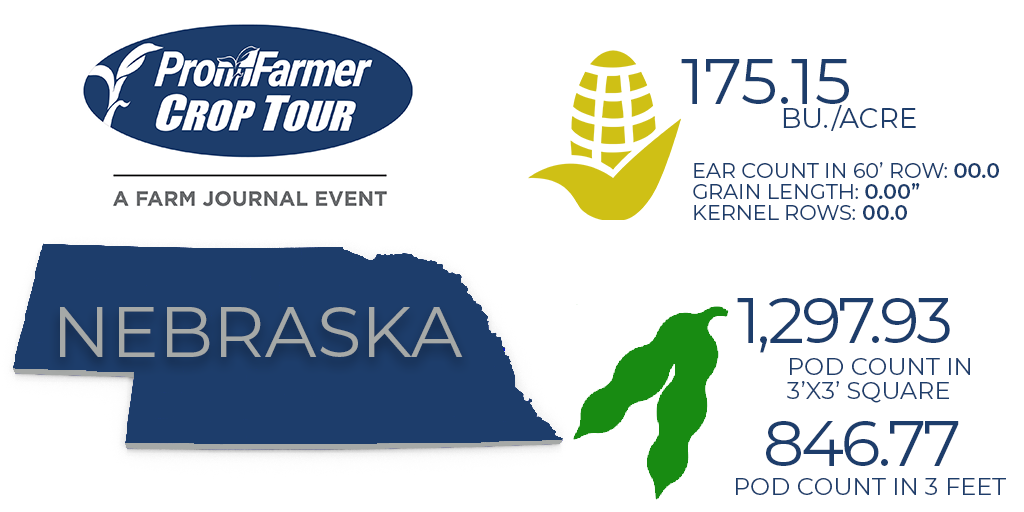
Nebraska yields are shaping up to be just slightly better than recent averages and more than 40% of the sampled fields were under irrigation. Corn bu. per acre is expected to come in just 1.6% better and soybeans are 6.9% better than the three-year average.
As a reminder, scouts are looking at yield potential today, acknowledging that there is a significant part of the growing season remaining that will be at the whim of Mother Nature. Therefore, down corn, lodged soybeans and other harvest or Mother Nature-related losses will not be included in these estimates.
Tune in for LIVE analysis and to hear each upcoming state’s final numbers first—register here.
Indiana corn came in at 179.84 bu. per acre and soybeans per 3X3 square hit 1281.12, both sizeable jumps over the three-year average. The three-year average for corn bu. per acre is 171.67 and the average for soybeans per 3X3 square is 1134.86.
“My bias going into the tour was that we were going to have some challenges because of the heat and because of the dryness we saw in Ohio and Indiana,” says Jim Smith, who traveled on the eastern leg of the Pro Farmer Crop Tour. Overall, he said the yields for the Hoosier State were good, just not great.
Tip-back was common among the corn samples, largely related to heat and dry-weather stress. Scouts also noted the corn crop had lower temperatures throughout the year, so it could take longer to finish at the end of the season. This means more dryer gas, and more opportunity for crop diseases to sneak in.
Smith saw tip-back so severe it robbed one-third of the corn ear of kernels—stealing about 30 bu. of yield potential. It’s not all bad news though because that field still measured out at 199.8 bu. per acre yield.
Disease issues in corn and soybeans were minimal.
"Extremely consistent [soybean] crop, I'm really impressed with the beans here in Indiana," says Brian Grete, Pro Farmer editor on the eastern leg of the tour.
Here’s a quick look at each district’s results (corn measured in bu. per acre, soybeans in pods per 3X3 square):
- District 1
- Corn 192.00, 23 samples
- Soybeans 1350.53, 22 samples
- District 2
- Corn 163.35, 23 samples
- Soybeans 1269.27, 23 samples
- District 3
- Corn 170.32, 24 samples
- Soybeans 1203.88, 24 samples
- District 4
- Corn 186.54, 23 samples
- Soybeans 1107.18, 24 samples
- District 5
- Corn 186.01, 48 samples
- Soybeans 1308.64, 47 samples
- District 6
- Corn 176.04, 32 samples
- Soybeans 1389.90, 32 samples
In total, scouts pulled 173 corn samples and 172 soybean samples. Because of COVID-19 concerns there are fewer scouts on the tour, smaller carloads and more social distancing requirements. In 2019 scouts pulled 188 and 191 corn and soybean samples, respectively.
Nebraska fields are variable, corn to hit 175.15 bu. per acre and soybeans aim for 1297.93 pods per 3X3 square. Despite clear disadvantages when it comes to rainfall, especially on dryland acres, the crops are expected to perform.
Compared to the three-year average of 172.38 bu. per acre in corn and 1213.64 pods per 3X3 square, the state is showing just a slight improvement.
Like Indiana, scouts saw tip back in a lot of areas, but the yields were on track. Overall, scouts said northern Nebraska was drier and the south had good rainfall so even dry acres looked good, minus any areas with greensnap.
“All of the irrigated stuff looks really good, little tip back, good populations,” says Ted Seifried, scout on the western leg of the Pro Farmer Crop Tour. “Yesterday was interesting in Nebraska, we did see a lot of tip back, even under irrigation. We were in areas that guys might not have had as much access to water and could use [irrigation] as often.”
Very little disease is apparent in either crop as of now. However, weather conditions will continue to be important.
"We're on the verge of running out of moisture," says Tim Gregerson, scout on the western side who farms in Nebraska. "A yield-limiting factor for south Nebraska is from a bad cold snap in May."
Soybean yield potential sits in a good spot for the state—if they can get the rains needed to finish strong.
“If we do [get rain], we could be sitting on a really large soybean yield—maybe even bigger than what USDA is talking about,” Seifried adds.
Check out each district’s results (corn measured in bu. per acre, soybeans in pods per 3X3 square):
- District 2
- Corn 182.95, 3 samples
- Soybeans 1266.69, 3 samples
- District 3
- Corn 165.98, 74 samples
- Soybeans 1167.57, 74 samples
- District 5
- Corn 180.75, 28 samples
- Soybeans 1149.43, 26 samples
- District 6
- Corn 186.34, 95 samples
- Soybeans 1301.74, 94 samples
- District 8
- Corn 149.34, 16 samples
- Soybeans 1277.32, 14 samples
- District 9
- Corn 173.45, 89 samples
- Soybeans 1448.30, 90 samples
In total Nebraska scouts pulled 305 corn samples, 130 irrigated, and 301 soybean samples, 122 irrigated. Despite fewer boots-on-the-ground, scouts nearly matched 2019’s corn number at 307 and beat 2019’s soybean sample number of 300.


Comments
Something to say?
Log in or Sign up for free