Welcome to the IKCEST
Regional impacts of electricity system transition in Central Europe until 2035

Overall scenario ranges of system infrastructure and impacts

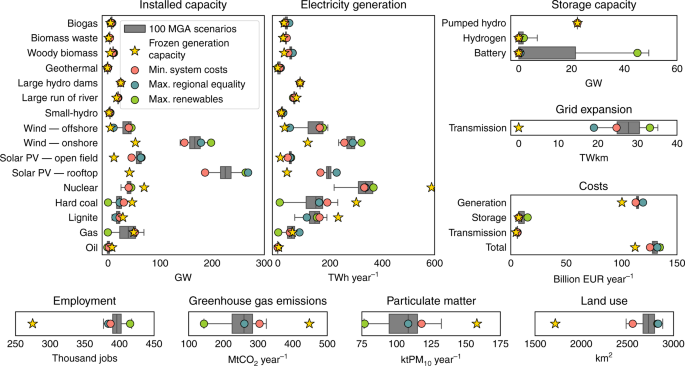
In these MGA scenarios, electricity generation varies considerably in the six countries for wind, solar PV, nuclear, and fossil fuels, indicating flexibility in implementing the national electricity targets, but it is relatively constant for biomass, geothermal, and hydropower (Fig. 1). Compared to the scenario with frozen generation capacity (without national electricity targets), the other 100 MGA scenarios (with targets) have higher electricity generation from offshore wind (33–192 TWh year−1 compared to 27  TWh year−1), onshore wind (233–320 TWh year−1 compared to 115 TWh year−1), open-field solar PV (37–53 TWh year−1 compared to 10 TWh year−1), and rooftop solar PV (164–231 TWh year−1 compared to 36 TWh year−1). In contrast, they have lower electricity generation from nuclear (216–371 TWh year−1 compared to 588 TWh year−1), hard coal (2–230 TWh year−1 compared to 300 TWh year−1), and lignite (65–188 TWh year−1 compared to 231 TWh year−1). Gas-based electricity generation is between 0 and 90 TWh year−1 compared to 57 TWh year−1. Despite the definite growth of solar PV and wind power, there is much leeway in this near-optimal space of 100 MGA scenarios for these technologies. Large reductions in nuclear and coal-based electricity generation are apparent to reach the national electricity targets. Gas-based electricity generation either increases or decreases depending on the other generation capacities.

Fig. 1: Scenarios of electricity generation in 2035.
figure1

The figure shows technology-specific generation, storage, and transmission, as well as associated costs and regional impacts for the scenario of frozen generation capacity and the 100 modeling to generate alternatives (MGA) scenarios. Amongst the 100 MGA scenarios, we highlight the scenarios of minimum system costs, maximum regional equality of system costs, and maximum renewable electricity generation. Box plot elements are: center line, median; box limits, upper and lower quartiles; whiskers, minimum and maximum values. MGA scenarios are generated with a slack of 20% above total levelized electricity generation costs of the cost-optimal solution in the EXPANSE model and assuming that each country meets its national electricity generation targets for 2035 (see “Methods”). Total system costs include annual capital and variable costs (i.e., fuel, operation, and maintenance) for electricity generation, storage, and transmission. Employment impact includes annual direct employment for electricity generation and storage, including jobs in construction, installation, operation, maintenance, and decommissioning. For biomass, coal, and lignite, we additionally include jobs in fuel extraction and transport. Greenhouse gas emissions impact includes annual direct greenhouse gas emissions from fuel combustion for electricity generation. Particulate matter impact includes annual direct particulate matter emissions from fuel combustion for electricity generation. Land use impact includes direct land use for electricity generation. Source data are provided in Supplementary Data 1.

The four distinct scenarios differ in terms of technology-specific electricity generation. The scenario with minimum system costs is characterized by relatively high centralized electricity generation from hard coal (190 TWh year−1), lignite (160 TWh year−1), offshore wind (161 TWh year−1), large hydropower dams (86 TWh year−1), large run-of river (63 TWh year−1), and biomass waste (35 TWh year−1), suggesting that these technologies improve cost efficiency. The scenario with maximum regional equality of system costs has comparatively high decentralized electricity generation: onshore wind (287 TWh year−1), rooftop solar PV (226 TWh year−1), open-field solar PV (48 TWh year−1), woody biomass (57 TWh year−1), biogas (45 TWh year−1), small hydropower (22 TWh year−1), geothermal (12 TWh year−1), and gas (84 TWh year−1). Due to their decentralized nature, these technologies improve regional equality. Nuclear electricity generation is 332 TWh year−1 and does not differ much between the scenarios of cost efficiency and regional equality. The scenario with maximum renewable electricity generation has high electricity generation from renewable technologies (1037 TWh year−1), nuclear plants (366 TWh year−1), and above-average lignite-based generation (150 TWh year−1). In this case, nuclear and fossil fuel electricity enable renewable electricity integration by keeping total system costs within the near-optimal range in 2035. Lignite rather than gas is selected by the model due to lower generation costs, which results in cost savings even with more renewable electricity. All distinct scenarios except for frozen generation capacity forego oil electricity generation (<1 TWh year−1).

Storage and transmission capacities vary considerably across 100 MGA scenarios, with up to 7 GW of additional hydrogen and 50 GW of additional battery storage capacity as compared to 2018. The scenarios with frozen generation capacity and minimum system costs have no additional storage capacity, whereas the scenario with maximum regional equality has 675 MW battery and 75 MW hydrogen storage. In comparison, the scenario with maximum renewable electricity generation requires very high amounts of 45 GW battery and 2 GW hydrogen storage. Storage capacity is thus associated with renewable electricity integration and, to a lesser extent, regional equality of system costs. To balance more intermittent renewable electricity, the scenario with maximum renewable electricity generation requires very high transmission capacity expansion of 33 TWkm in total too. In comparison to this scenario, the scenario with minimum system costs requires 25 TWkm and therefore 24% less transmission capacity expansion, while the scenario with maximum regional equality requires only 19 TWkm and therefore 42% less. Thus, transmission capacity expansion is associated with renewable electricity integration and, to a lesser extent, cost efficiency.

Electricity generation, storage, transmission, and total system costs are consistently higher for all 100 MGA scenarios compared to the scenario with frozen generation capacity (that has generation capacity of 2018 without the six countries reaching their national electricity targets). For MGA scenarios, these costs vary between 112 and 120 billion EUR year−1 for generation, 7 and 15 billion EUR year−1 for storage, 5 and 6 billion EUR year−1 for transmission, and 125 and 137 billion EUR year−1 for the total system costs. For frozen generation capacity, these costs are 100 billion EUR year−1, 7 billion EUR year−1, 5 billion EUR year−1, and 112 billion EUR year−1, respectively. The scenario with minimum system costs has low generation, storage, and total system costs at 112 billion EUR year−1, 7 billion EUR year−1, and 125 billion EUR year−1, but high transmission costs at 6 billion EUR year−1. The scenario with maximum regional equality of system costs has high generation and total system costs at 119 billion EUR year−1 and 132 billion EUR year−1, but low storage and transmission costs at 7 billion EUR year−1 and 5 billion EUR year−1. The scenario with maximum renewable electricity has low generation costs of 113 billion EUR year−1, but high storage, transmission, and total system costs at 15 billion EUR year−1, 6 billion EUR year−1, and 134 billion EUR year−1. Renewable electricity integration, rather than regional equality of system costs, increases total system costs.

Direct employment for all MGA scenarios is 376–417 thousand jobs, attributed mainly to increased solar PV and wind capacities. In comparison, the scenario with frozen generation capacity has far less employment with 274 thousand jobs, attributed mainly to existing nuclear and coal capacities. The scenarios with minimum system costs and maximum regional equality have similar employment of 387 and 384 thousand jobs, respectively. The scenario with maximum renewable electricity generation has high employment with 415 thousand jobs. Overall, national electricity targets lead to an increase in employment in the electricity sector. Maximizing renewable generation, rather than minimizing system costs or maximizing regional equality of system costs, leads to increases in employment.

In terms of environmental impacts, direct greenhouse gas emissions from electricity generation for all MGA scenarios is between 144 and 324 MtCO2-eq year−1, which is much lower than 448 MtCO2-eq year−1 for the scenario with frozen generation capacity. Compared to all MGA scenarios, the scenario with minimum system costs has high greenhouse gas emissions of 304 MtCO2-eq year−1. In comparison, the scenario with maximum regional equality has average emissions of 260 MtCO2-eq year−1, and the scenario with maximum renewable electricity generation has the lowest emissions of 144 MtCO2-eq year−1. Direct particulate matter emissions from electricity generation are between 76 and 122 ktPM10-eq year−1 for all MGA scenarios, which is far less than in the scenario with frozen generation capacity (135 ktPM10-eq year−1). For scenarios with minimum system costs and maximum regional equality, particulate matter emissions are 118 and 100 ktPM10-eq year−1, respectively. The scenario with maximum renewable electricity generation has low emissions of 77 ktPM10-eq year−1. Therefore, to reduce greenhouse gas and particulate matter emissions, the priority is to maximize renewable electricity generation and, to a lesser extent, regional equality of system costs, instead of minimizing total system costs. The main reason why regional equality enables lower greenhouse gas and particulate matter emissions than cost efficiency is twofold. First, regional equality discourages spatial concentration of large centralized coal generation with high emissions. Second, regional equality encourages a regionally even distribution of generation capacities and this is mostly achieved with additional renewable generation capacities with low direct emissions.

Direct land use for electricity generation infrastructures for all MGA scenarios is between 2486 and 2882 km2, which is far higher than in the scenario with frozen generation capacity with 1719 km2. The increase in land use is mostly due to higher onshore wind, open-field solar PV, woody biomass, and biogas capacities. The scenario with minimum system costs has low land use of 2557 km2 compared to the scenario with maximum regional equality with 2833 km2 due to a more cost efficient spatial allocation of wind and solar PV, and higher fossil fuel capacities, which require less land. The scenario with maximum renewable electricity generation has relatively high land use of 2824 km2. Overall, high land use is attributed to the focus on regional equality of system costs and renewable electricity generation, whereas less extensive land use is attributed to cost efficiency.

Regional distribution of electricity system infrastructure

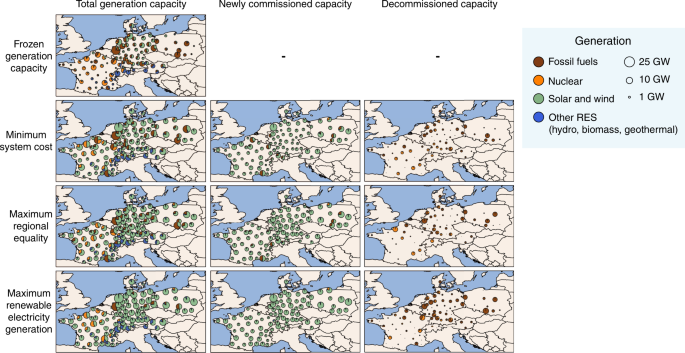
The scenario with frozen generation capacity that represents generation in 2018 (Fig. 2) has high hydropower capacities in Austria and Switzerland; a mix of biomass, fossil fuels, solar PV, and wind capacities in Denmark and Germany; high nuclear capacities in France; and high fossil fuel capacities (mostly coal and lignite) in Poland (see Supplementary Fig. 1 for electricity generation). Existing regional generation, storage, and transmission capacities provide enough flexible electricity for all regions, even with the projected 8% overall increase in electricity demand for 2035 (see “Methods”). Storage capacity for this scenario is entirely in the form of pumped hydropower and located mostly in west Austria, south-east France, and in Switzerland (Fig. 3). With these generation and storage infrastructures, transmission capacities are high in north and south-east France, south-west and east Germany, and north-east Switzerland.

Fig. 2: Regional differences in electricity generation capacity in 2035.
figure2

The figure depicts total, newly commissioned, and decommissioned electricity generation capacity as compared to 2018 at each of the 100 grid nodes for the four distinct scenarios of frozen generation capacity, minimum system costs, maximum regional equality of system costs, and maximum renewable electricity generation. In the scenarios of minimum system costs, maximum regional equality of system costs, and maximum renewable electricity generation, each country meets its national electricity generation targets for 2035 (see “Methods”). Generation capacities are aggregated to the four categories for visualization purposes. Fossil fuels category includes gas, hard coal, lignite, and oil. Solar and wind category includes onshore wind, offshore wind, rooftop solar PV, and open-field solar PV. Other renewable energy sources (RES) category includes hydropower (including large dams, large run-of-river, and small hydropower), biomass (including biogas, biomass waste, and woody biomass), and geothermal power.

Fig. 3: Regional changes in storage and transmission capacity in 2035.

The figure depicts total storage and transmission capacity as well as increases in this capacity at each of the 100 grid nodes as compared to 2018 for the four distinct scenarios of frozen generation capacity, minimum system costs, maximum regional equality of system costs, and maximum renewable electricity generation. In the scenarios of minimum system cost, maximum regional equality of system costs, and maximum renewable electricity generation, each country meets its national electricity generation targets for 2035 (see “Methods”). PHS pumped hydro storage; HVDC high voltage direct current transmission line; HVAC high voltage alternating current transmission line.

The scenario with minimum system costs is characterized by relatively spatially concentrated generation capacities. Compared to all MGA scenarios, this scenario has high offshore wind capacities, mostly off the coasts of France and Germany. High onshore wind capacities are near the coasts, across Poland and in east Austria, due to high wind speeds and low generation costs. High solar PV capacities are located in south France and Switzerland due to high solar irradiation and low generation costs. Less nuclear generation in France and coal-based generation in Germany and Poland are required as countries meet their national electricity targets. More gas-based generation in France, Germany, Poland, and Switzerland are required to balance intermittent renewable electricity. Storage capacities do not need to be extended in this scenario, suggesting that existing pumped hydropower and fossil fuel capacities provide sufficient flexibility. However, significant transmission capacity expansions are needed in all countries, except for Denmark. Spatially concentrated generation thus improves cost efficiency.

The scenario with maximum regional equality of system costs is characterized by a more regionally equal distribution of generation capacity. This is achieved by increasing solar PV and wind capacities more evenly in all regions, in addition to keeping some existing nuclear and fossil fuel capacities. Onshore wind and solar PV are allocated in less windy and sunny regions with higher generation costs. Offshore wind capacities are low as they increase regional inequality of system costs. This scenario has lower coal-based generation in Germany and Poland, but higher gas-based generation in France, Poland, and Switzerland. Nuclear capacity is completely decommissioned in Germany and Switzerland, but most is kept in France. Additional storage capacity is not needed in almost all regions, except for battery and hydrogen storage in Denmark due to higher residual loads and low transmission flexibility. Transmission expansion is needed to a lesser extent in all countries than in the scenario with minimum system costs. A more regionally equal distribution of system costs requires less transmission capacity and more storage capacity as compared to the scenario with minimum system costs. Overall, decentralized generation and storage improve regional equality.

The scenario with maximum renewable electricity generation is characterized by a substantial increase in solar PV and wind capacities in all regions and a substantial decrease in fossil fuel capacities in Austria, Denmark, France, Germany, and Poland. Although low, some remaining fossil fuel capacities (mostly lignite) are located in the west and east of Germany and south Poland. France and Switzerland still have relatively high nuclear capacity. Due to the lack of fossil fuel capacities to balance intermittent electricity, high battery storage capacities are required in most regions, in addition to high transmission capacities. Highest storage capacities are installed near the coasts of Denmark, France, Germany, and Poland, and between Austria and Germany, and between Germany and Poland. Switzerland requires almost no battery storage, due to sufficient pumped hydropower. Hydrogen storage is installed in north and south Poland. Transmission capacity expansion is highest between France and Germany, and Germany and Poland. In sum, renewable and nuclear generation, as well as storage and transmission improve the aim of maximizing renewable electricity integration.

Regional impacts of electricity system infrastructure

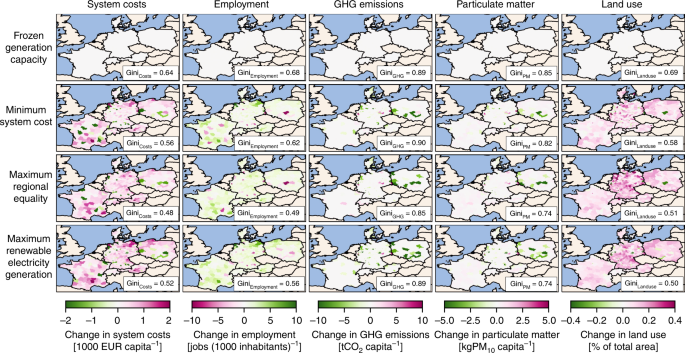
When national electricity targets are met, some NUTS-3 regions are more impacted than others as compared to the scenario with frozen generation capacity that represents 2018, as shown in Fig. 4 (see Supplementary Fig. 2 for total impacts). The scenario with minimum system costs has a high increase in system costs per capita near the coasts, such as in Weser-Ems (Germany) and West Pomerania (Poland) due to high wind speeds and land availability. Substantial decreases in system costs are in regions with currently high nuclear and fossil fuel capacities in France, Germany, and Poland. The scenario with maximum regional equality has more regionally even and less extreme increases in system costs. Regional system costs increase toward inland regions due to more onshore wind and solar PV. There are fewer regions with decreased system costs, especially in France. One exception is the region of Spree-Neisse (Germany) that decommissions coal capacities. The scenario of maximum renewable electricity generation has a relatively high increase in system costs, both near the coasts and toward the inland due to high solar PV, wind, storage, and transmission capacities. Similar to all other distinct scenarios, we find a net decrease in system costs in regions with currently high coal capacities. In contrast, there are fewer changes in system costs in regions with currently high nuclear capacities. For all distinct scenarios, we find minor changes in system costs per capita in Denmark and Switzerland.

Fig. 4: Regional impacts from generation, storage, and transmission in 2035.
figure4

The values show changes in system costs, employment, greenhouse gas (GHG) emissions, particulate matter emissions, and land use per NUTS-3 region for the four distinct scenarios of frozen generation capacity, minimum system costs, maximum regional equality of system costs, and maximum renewable electricity generation, as compared to the scenario with frozen generation capacity that represents the electricity system infrastructure from 2018. A Gini index of 1.0 indicates perfect regional inequality and a Gini index of 0.0 indicates perfect regional equality. In the scenarios of minimum system cost, maximum regional equality of system costs, and maximum renewable electricity generation, each country meets its national electricity generation targets for 2035 (see “Methods”). System costs include annual capital and variable costs (i.e., fuel, operation, and maintenance) for electricity generation, storage, and transmission. Employment impact includes annual direct employment for electricity generation and storage, including jobs in construction, installation, operation, maintenance, and decommissioning. For biomass, coal, and lignite, we additionally include jobs in fuel extraction and transport. Greenhouse gas emissions impact includes annual direct greenhouse gas emissions from fuel combustion for electricity generation. Particulate matter impact includes annual direct particulate matter emissions from fuel combustion for electricity generation. Land use impact includes direct land use for electricity generation. Source data are provided in Supplementary Data 1.

Regarding employment, the scenario with minimum system costs has the highest net increase in jobs in Austria and near the coasts of France, Germany, and Poland due to high wind capacity. The highest increase of up to 53 jobs per 1000 inhabitants is in the regions of Weser-Ems (Germany), West Pomerania (Poland), and Languedoc-Roussillon (France) as a result of high wind and solar PV capacities. The most significant net decrease in jobs is in regions with currently high nuclear and coal capacities in France, Germany, and Poland. The scenario with maximum regional equality has a more evenly distributed increase in jobs, where some regions in France, like Upper Normandy, with less jobs from decommissioned nuclear capacities have only minor net changes due to additional jobs from solar PV and wind. The scenario with maximum renewable electricity generation combines the spatial patterns from the two former scenarios. In this scenario, high increases in jobs occur near the coasts of Weser-Ems (Germany), West Pomerania (Poland), and Mecklenburg-Vorpommern (Germany), but also in inland regions of Salzburg (Austria) and Thuringia (Germany). We find a lower decrease in jobs in regions with currently high employment in coal-based generation due to additional employment in solar PV and wind generation. For example, the coal region of Piotrków County (Poland) has no net job losses for the scenario with maximum renewable electricity generation, as compared to ten lost jobs per 1000 inhabitants in the scenarios with minimum system costs and maximum regional equality.

For direct greenhouse gas and particulate matter emissions from electricity generation as well as land use, we observe similar patterns across all scenarios. The scenarios with minimum system costs, maximum regional equality, and maximum renewable electricity generation that all achieve national electricity targets for 2035 have decreases in both types of emissions in regions with currently high coal-based generation, especially in Spree-Neisse (Germany), Radomski and Sosnowiecki (Poland). Some regions have increased emissions, such as Neuss and Görlitz (Germany), due to higher gas-based electricity generation. For this reason, the scenario with maximum regional equality has a slight increase in emissions in Bouches-du-Rhône (France) and Zurich (Switzerland). The scenario of maximum renewable electricity generation has the most substantial decrease in emissions and most regions are benefitting from these impacts. Regarding the land use for electricity generation, we find an increase for most regions and all distinct scenarios that achieve national electricity targets. This is due to higher onshore wind, open-field solar PV, biogas, and woody biomass capacities. The scenario with minimum system costs has increased land use near the coasts of Denmark, Germany, and Poland, at the borders of Germany and Poland, in east Austria and south France. In comparison, the scenario with maximum regional equality has even higher land use due to higher renewable generation, especially in Weser-Ems (Germany), which amounts to 0.65% of total regional land. The scenario with maximum renewable electricity generation has similarly high land use, but it has fewer regions with severe increase as the land use is more regionally even. Only some coal regions in Germany and Poland have a net decrease for all distinct scenarios, including Spree-Neisse and Saalekreis (Germany) and Koniński (Poland).

Regional equality and trade-offs

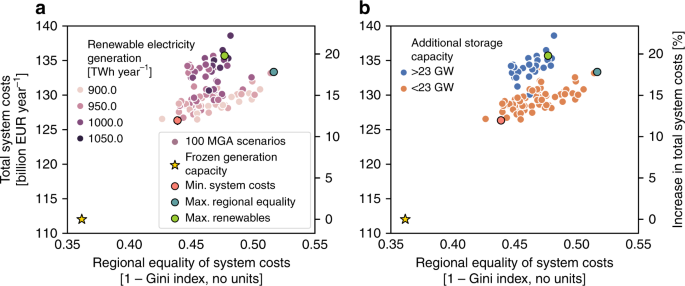
When analyzing all 100 MGA scenarios, we find a significant trade-off between minimizing total system costs, maximizing regional equality of system costs, and maximizing renewable electricity generation (Fig. 5). These three aims thus cannot be optimized simultaneously. Compared to the scenario with minimum system costs, the scenario with maximum regional equality has 18% higher regional equality of system costs per capita (52% compared to 44%) and 4% higher renewable electricity generation (928 TWh year−1 compared to 892 TWh year−1). As a trade-off, it has 6% higher total system costs (132 billion EUR year−1 compared to 125 billion EUR year−1). Thus, regional equality improves renewable electricity integration, but decreases cost efficiency. Compared to the scenario with maximum regional equality, the scenario with maximum renewable electricity generation has 12% higher renewable electricity generation (1037 TWh year−1 compared to 928 TWh year−1), but it also has 2% higher total system costs (134 billion EUR year−1 compared to 132 billion EUR year−1) and 8% lower regional equality of system costs (48% compared to 52%). Therefore, renewable electricity generation leads to medium regional equality due to spatial constraints of allocating renewable generation capacities, and relatively lower cost efficiency due to high investment needs in renewable generation and storage capacities.

Fig. 5: Trade-off between total system costs and regional equality in 2035.
figure5

Values show total system costs and regional equality of system costs per capita for the scenario of frozen generation capacity and 100 modeling to generate alternatives (MGA) scenarios. Amongst the 100 MGA scenarios, we highlight the scenarios of minimum system costs, maximum regional equality of system costs, and maximum renewable electricity generation. Percentage values on the second y-axis are relative to the scenario of frozen generation capacity. a Colors represent the trade-off with the extent of renewable electricity generation. b Colors represent the trade-off with additionally required storage capacity, where the cut-off value of 23 GW additional capacity was selected for visual purposes. MGA scenarios are generated with a slack of 20% above total levelized electricity generation costs of the cost-optimal solution in EXPANSE and assuming that each country meets its national electricity generation targets for 2035 (see “Methods”). Source data are provided in Supplementary Data 1.

The trade-offs between total system costs, regional equality of system costs, renewable electricity generation, and the four other regional impacts are shown in Fig. 6. Compared to the scenario with minimum system costs, the scenario with maximum regional equality has 14% lower greenhouse gas emissions, 8% lower particulate matter emissions, 11% higher land use, and 1% lower employment. Compared to the scenario with maximum regional equality, the scenario with maximum renewable electricity generation has 45% lower greenhouse gas emissions, 29% lower particulate matter emissions, similar land use, and 8% higher employment. These results suggest that some aims improve only certain regional impacts. Compared to all MGA scenarios, the aim of minimizing total system costs enables relatively lower land use, but also lower employment, as well as higher greenhouse gas and particulate matter emissions. By this comparison, the aim of maximizing regional equality of system costs means medium levels of greenhouse gas and particulate matter emissions, but higher land use and lower employment. The aim of maximizing renewable electricity generation encourages higher employment, and lower greenhouse gas and particulate matter emissions, but also higher land use.

Fig. 6: Costs, regional equality, renewable electricity generation, and impacts in 2035.

Trade-off between regional impacts and total system costs, regional equality of system costs per capita, and renewable electricity generation. Regional impacts include employment, greenhouse gas and particulate matter emissions, and land use. Gray scatter points depict the 100 MGA scenarios. We additionally highlight the four distinct scenarios of frozen generation capacity, minimum system costs, maximum regional equality of system costs, and maximum renewable electricity generation. Percentage values on the second y-axis are relative to the frozen generation scenario. MGA scenarios are generated with a slack of 20% above total levelized electricity generation costs of the cost-optimal solution in EXPANSE model and assuming that each country meets its national electricity generation targets for 2035 (see “Methods”). Source data are provided in Supplementary Data 1.

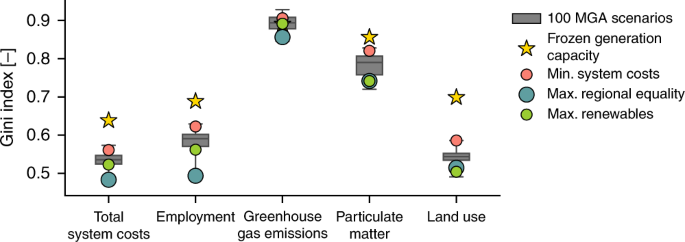
We also evaluate how even all these impacts are distributed across the sub-national regions (Fig. 7), which we measure with the Gini index (see “Methods”). Regarding system costs per capita, the scenario with frozen generation capacity has the least even distribution of system costs. Amongst all 100 MGA scenarios that reach national electricity targets, the scenario with minimum system costs has a rather uneven distribution of system costs. In contrast, the scenario with maximum regional equality has the most even distribution, whereas the scenario with maximum renewable electricity generation has above-average equality too. Regarding employment, the scenario with frozen generation capacity has the most uneven regional distribution of jobs per 1000 inhabitants and this is improved in the scenarios with minimum system costs or especially maximum regional equality. The scenario with maximum renewable electricity generation has an above-average equality in terms of employment impacts too. Overall, employment impacts are more unevenly distributed across regions compared to system costs, because technology-specific generation costs (main component of system costs) vary less than jobs. For example, levelized electricity generation costs of wind and solar PV in 2035 are similar to those of fossil fuels, but the associated jobs per MWh are up to five times lower. Therefore, regional differences in electricity generation lead to more extreme regional differences in jobs than in system costs.

Fig. 7: Gini index of regional impacts.
figure7

Box plots (in gray) show the Gini index for the spatial distribution of regional impacts on system costs, employment, greenhouse gas emissions, particulate matter emissions, and land use for 100 modeling to generate alternatives (MGA) scenarios. In addition, we highlight the Gini index of regional impacts for the four distinct scenarios of frozen generation capacity, minimum system costs, maximum regional equality of system costs, and maximum renewable electricity generation. A Gini index of 1.0 indicates perfect regional inequality and a Gini index of 0.0 indicates perfect regional equality. Box plot elements: center line, median; box limits, upper and lower quartiles; whiskers, minimum and maximum values. MGA scenarios are generated with a slack of 20% above total levelized electricity generation costs of the cost-optimal solution in EXPANSE and assuming that each country meets its national electricity generation targets for 2035 (see “Methods”). Source data are provided in Supplementary Data 1.

Regarding environmental impacts, greenhouse gas emissions are much more unevenly distributed across regions. The scenario with frozen generation capacity has a medium even distribution of greenhouse gas emissions and the scenario with minimum system costs is less even due to a substantial decrease of emissions in some regions and minor changes in others. The greenhouse gas emissions are lower and slightly more evenly distributed for the scenarios with maximum regional equality and maximum renewable electricity generation. Particulate matter emissions for all MGA scenarios are lower and more evenly distributed than for the scenario with frozen generation capacity due to decreased emissions in coal regions. The scenario with minimum system costs has an uneven distribution due to high emissions in few coal regions. The scenarios with maximum regional equality and maximum renewable electricity generation have a more even distribution of low particulate matter emissions. Regarding land use, the scenario with frozen generation capacity has the most uneven distribution and land use for all MGA scenarios that achieve country targets is higher, yet more evenly distributed. The scenario with minimum system costs has a relatively uneven distribution, whereas the most even distribution is in the scenario with maximum renewable electricity generation, followed by the scenario with maximum regional equality. Overall, we find that maximizing regional equality of system costs and renewable electricity generation leads to rather high regional equality of employment, greenhouse gas and particulate matter emissions, and land use. Minimizing system costs leads to rather low regional equality of all impacts, although regional equality is higher than if national electricity targets are not met.

Original Text (This is the original text for your reference.)

Overall scenario ranges of system infrastructure and impacts

In these MGA scenarios, electricity generation varies considerably in the six countries for wind, solar PV, nuclear, and fossil fuels, indicating flexibility in implementing the national electricity targets, but it is relatively constant for biomass, geothermal, and hydropower (Fig. 1). Compared to the scenario with frozen generation capacity (without national electricity targets), the other 100 MGA scenarios (with targets) have higher electricity generation from offshore wind (33–192 TWh year−1 compared to 27  TWh year−1), onshore wind (233–320 TWh year−1 compared to 115 TWh year−1), open-field solar PV (37–53 TWh year−1 compared to 10 TWh year−1), and rooftop solar PV (164–231 TWh year−1 compared to 36 TWh year−1). In contrast, they have lower electricity generation from nuclear (216–371 TWh year−1 compared to 588 TWh year−1), hard coal (2–230 TWh year−1 compared to 300 TWh year−1), and lignite (65–188 TWh year−1 compared to 231 TWh year−1). Gas-based electricity generation is between 0 and 90 TWh year−1 compared to 57 TWh year−1. Despite the definite growth of solar PV and wind power, there is much leeway in this near-optimal space of 100 MGA scenarios for these technologies. Large reductions in nuclear and coal-based electricity generation are apparent to reach the national electricity targets. Gas-based electricity generation either increases or decreases depending on the other generation capacities.

Fig. 1: Scenarios of electricity generation in 2035.
figure1

The figure shows technology-specific generation, storage, and transmission, as well as associated costs and regional impacts for the scenario of frozen generation capacity and the 100 modeling to generate alternatives (MGA) scenarios. Amongst the 100 MGA scenarios, we highlight the scenarios of minimum system costs, maximum regional equality of system costs, and maximum renewable electricity generation. Box plot elements are: center line, median; box limits, upper and lower quartiles; whiskers, minimum and maximum values. MGA scenarios are generated with a slack of 20% above total levelized electricity generation costs of the cost-optimal solution in the EXPANSE model and assuming that each country meets its national electricity generation targets for 2035 (see “Methods”). Total system costs include annual capital and variable costs (i.e., fuel, operation, and maintenance) for electricity generation, storage, and transmission. Employment impact includes annual direct employment for electricity generation and storage, including jobs in construction, installation, operation, maintenance, and decommissioning. For biomass, coal, and lignite, we additionally include jobs in fuel extraction and transport. Greenhouse gas emissions impact includes annual direct greenhouse gas emissions from fuel combustion for electricity generation. Particulate matter impact includes annual direct particulate matter emissions from fuel combustion for electricity generation. Land use impact includes direct land use for electricity generation. Source data are provided in Supplementary Data 1.

The four distinct scenarios differ in terms of technology-specific electricity generation. The scenario with minimum system costs is characterized by relatively high centralized electricity generation from hard coal (190 TWh year−1), lignite (160 TWh year−1), offshore wind (161 TWh year−1), large hydropower dams (86 TWh year−1), large run-of river (63 TWh year−1), and biomass waste (35 TWh year−1), suggesting that these technologies improve cost efficiency. The scenario with maximum regional equality of system costs has comparatively high decentralized electricity generation: onshore wind (287 TWh year−1), rooftop solar PV (226 TWh year−1), open-field solar PV (48 TWh year−1), woody biomass (57 TWh year−1), biogas (45 TWh year−1), small hydropower (22 TWh year−1), geothermal (12 TWh year−1), and gas (84 TWh year−1). Due to their decentralized nature, these technologies improve regional equality. Nuclear electricity generation is 332 TWh year−1 and does not differ much between the scenarios of cost efficiency and regional equality. The scenario with maximum renewable electricity generation has high electricity generation from renewable technologies (1037 TWh year−1), nuclear plants (366 TWh year−1), and above-average lignite-based generation (150 TWh year−1). In this case, nuclear and fossil fuel electricity enable renewable electricity integration by keeping total system costs within the near-optimal range in 2035. Lignite rather than gas is selected by the model due to lower generation costs, which results in cost savings even with more renewable electricity. All distinct scenarios except for frozen generation capacity forego oil electricity generation (<1 TWh year−1).

Storage and transmission capacities vary considerably across 100 MGA scenarios, with up to 7 GW of additional hydrogen and 50 GW of additional battery storage capacity as compared to 2018. The scenarios with frozen generation capacity and minimum system costs have no additional storage capacity, whereas the scenario with maximum regional equality has 675 MW battery and 75 MW hydrogen storage. In comparison, the scenario with maximum renewable electricity generation requires very high amounts of 45 GW battery and 2 GW hydrogen storage. Storage capacity is thus associated with renewable electricity integration and, to a lesser extent, regional equality of system costs. To balance more intermittent renewable electricity, the scenario with maximum renewable electricity generation requires very high transmission capacity expansion of 33 TWkm in total too. In comparison to this scenario, the scenario with minimum system costs requires 25 TWkm and therefore 24% less transmission capacity expansion, while the scenario with maximum regional equality requires only 19 TWkm and therefore 42% less. Thus, transmission capacity expansion is associated with renewable electricity integration and, to a lesser extent, cost efficiency.

Electricity generation, storage, transmission, and total system costs are consistently higher for all 100 MGA scenarios compared to the scenario with frozen generation capacity (that has generation capacity of 2018 without the six countries reaching their national electricity targets). For MGA scenarios, these costs vary between 112 and 120 billion EUR year−1 for generation, 7 and 15 billion EUR year−1 for storage, 5 and 6 billion EUR year−1 for transmission, and 125 and 137 billion EUR year−1 for the total system costs. For frozen generation capacity, these costs are 100 billion EUR year−1, 7 billion EUR year−1, 5 billion EUR year−1, and 112 billion EUR year−1, respectively. The scenario with minimum system costs has low generation, storage, and total system costs at 112 billion EUR year−1, 7 billion EUR year−1, and 125 billion EUR year−1, but high transmission costs at 6 billion EUR year−1. The scenario with maximum regional equality of system costs has high generation and total system costs at 119 billion EUR year−1 and 132 billion EUR year−1, but low storage and transmission costs at 7 billion EUR year−1 and 5 billion EUR year−1. The scenario with maximum renewable electricity has low generation costs of 113 billion EUR year−1, but high storage, transmission, and total system costs at 15 billion EUR year−1, 6 billion EUR year−1, and 134 billion EUR year−1. Renewable electricity integration, rather than regional equality of system costs, increases total system costs.

Direct employment for all MGA scenarios is 376–417 thousand jobs, attributed mainly to increased solar PV and wind capacities. In comparison, the scenario with frozen generation capacity has far less employment with 274 thousand jobs, attributed mainly to existing nuclear and coal capacities. The scenarios with minimum system costs and maximum regional equality have similar employment of 387 and 384 thousand jobs, respectively. The scenario with maximum renewable electricity generation has high employment with 415 thousand jobs. Overall, national electricity targets lead to an increase in employment in the electricity sector. Maximizing renewable generation, rather than minimizing system costs or maximizing regional equality of system costs, leads to increases in employment.

In terms of environmental impacts, direct greenhouse gas emissions from electricity generation for all MGA scenarios is between 144 and 324 MtCO2-eq year−1, which is much lower than 448 MtCO2-eq year−1 for the scenario with frozen generation capacity. Compared to all MGA scenarios, the scenario with minimum system costs has high greenhouse gas emissions of 304 MtCO2-eq year−1. In comparison, the scenario with maximum regional equality has average emissions of 260 MtCO2-eq year−1, and the scenario with maximum renewable electricity generation has the lowest emissions of 144 MtCO2-eq year−1. Direct particulate matter emissions from electricity generation are between 76 and 122 ktPM10-eq year−1 for all MGA scenarios, which is far less than in the scenario with frozen generation capacity (135 ktPM10-eq year−1). For scenarios with minimum system costs and maximum regional equality, particulate matter emissions are 118 and 100 ktPM10-eq year−1, respectively. The scenario with maximum renewable electricity generation has low emissions of 77 ktPM10-eq year−1. Therefore, to reduce greenhouse gas and particulate matter emissions, the priority is to maximize renewable electricity generation and, to a lesser extent, regional equality of system costs, instead of minimizing total system costs. The main reason why regional equality enables lower greenhouse gas and particulate matter emissions than cost efficiency is twofold. First, regional equality discourages spatial concentration of large centralized coal generation with high emissions. Second, regional equality encourages a regionally even distribution of generation capacities and this is mostly achieved with additional renewable generation capacities with low direct emissions.

Direct land use for electricity generation infrastructures for all MGA scenarios is between 2486 and 2882 km2, which is far higher than in the scenario with frozen generation capacity with 1719 km2. The increase in land use is mostly due to higher onshore wind, open-field solar PV, woody biomass, and biogas capacities. The scenario with minimum system costs has low land use of 2557 km2 compared to the scenario with maximum regional equality with 2833 km2 due to a more cost efficient spatial allocation of wind and solar PV, and higher fossil fuel capacities, which require less land. The scenario with maximum renewable electricity generation has relatively high land use of 2824 km2. Overall, high land use is attributed to the focus on regional equality of system costs and renewable electricity generation, whereas less extensive land use is attributed to cost efficiency.

Regional distribution of electricity system infrastructure

The scenario with frozen generation capacity that represents generation in 2018 (Fig. 2) has high hydropower capacities in Austria and Switzerland; a mix of biomass, fossil fuels, solar PV, and wind capacities in Denmark and Germany; high nuclear capacities in France; and high fossil fuel capacities (mostly coal and lignite) in Poland (see Supplementary Fig. 1 for electricity generation). Existing regional generation, storage, and transmission capacities provide enough flexible electricity for all regions, even with the projected 8% overall increase in electricity demand for 2035 (see “Methods”). Storage capacity for this scenario is entirely in the form of pumped hydropower and located mostly in west Austria, south-east France, and in Switzerland (Fig. 3). With these generation and storage infrastructures, transmission capacities are high in north and south-east France, south-west and east Germany, and north-east Switzerland.

Fig. 2: Regional differences in electricity generation capacity in 2035.
figure2

The figure depicts total, newly commissioned, and decommissioned electricity generation capacity as compared to 2018 at each of the 100 grid nodes for the four distinct scenarios of frozen generation capacity, minimum system costs, maximum regional equality of system costs, and maximum renewable electricity generation. In the scenarios of minimum system costs, maximum regional equality of system costs, and maximum renewable electricity generation, each country meets its national electricity generation targets for 2035 (see “Methods”). Generation capacities are aggregated to the four categories for visualization purposes. Fossil fuels category includes gas, hard coal, lignite, and oil. Solar and wind category includes onshore wind, offshore wind, rooftop solar PV, and open-field solar PV. Other renewable energy sources (RES) category includes hydropower (including large dams, large run-of-river, and small hydropower), biomass (including biogas, biomass waste, and woody biomass), and geothermal power.

Fig. 3: Regional changes in storage and transmission capacity in 2035.

The figure depicts total storage and transmission capacity as well as increases in this capacity at each of the 100 grid nodes as compared to 2018 for the four distinct scenarios of frozen generation capacity, minimum system costs, maximum regional equality of system costs, and maximum renewable electricity generation. In the scenarios of minimum system cost, maximum regional equality of system costs, and maximum renewable electricity generation, each country meets its national electricity generation targets for 2035 (see “Methods”). PHS pumped hydro storage; HVDC high voltage direct current transmission line; HVAC high voltage alternating current transmission line.

The scenario with minimum system costs is characterized by relatively spatially concentrated generation capacities. Compared to all MGA scenarios, this scenario has high offshore wind capacities, mostly off the coasts of France and Germany. High onshore wind capacities are near the coasts, across Poland and in east Austria, due to high wind speeds and low generation costs. High solar PV capacities are located in south France and Switzerland due to high solar irradiation and low generation costs. Less nuclear generation in France and coal-based generation in Germany and Poland are required as countries meet their national electricity targets. More gas-based generation in France, Germany, Poland, and Switzerland are required to balance intermittent renewable electricity. Storage capacities do not need to be extended in this scenario, suggesting that existing pumped hydropower and fossil fuel capacities provide sufficient flexibility. However, significant transmission capacity expansions are needed in all countries, except for Denmark. Spatially concentrated generation thus improves cost efficiency.

The scenario with maximum regional equality of system costs is characterized by a more regionally equal distribution of generation capacity. This is achieved by increasing solar PV and wind capacities more evenly in all regions, in addition to keeping some existing nuclear and fossil fuel capacities. Onshore wind and solar PV are allocated in less windy and sunny regions with higher generation costs. Offshore wind capacities are low as they increase regional inequality of system costs. This scenario has lower coal-based generation in Germany and Poland, but higher gas-based generation in France, Poland, and Switzerland. Nuclear capacity is completely decommissioned in Germany and Switzerland, but most is kept in France. Additional storage capacity is not needed in almost all regions, except for battery and hydrogen storage in Denmark due to higher residual loads and low transmission flexibility. Transmission expansion is needed to a lesser extent in all countries than in the scenario with minimum system costs. A more regionally equal distribution of system costs requires less transmission capacity and more storage capacity as compared to the scenario with minimum system costs. Overall, decentralized generation and storage improve regional equality.

The scenario with maximum renewable electricity generation is characterized by a substantial increase in solar PV and wind capacities in all regions and a substantial decrease in fossil fuel capacities in Austria, Denmark, France, Germany, and Poland. Although low, some remaining fossil fuel capacities (mostly lignite) are located in the west and east of Germany and south Poland. France and Switzerland still have relatively high nuclear capacity. Due to the lack of fossil fuel capacities to balance intermittent electricity, high battery storage capacities are required in most regions, in addition to high transmission capacities. Highest storage capacities are installed near the coasts of Denmark, France, Germany, and Poland, and between Austria and Germany, and between Germany and Poland. Switzerland requires almost no battery storage, due to sufficient pumped hydropower. Hydrogen storage is installed in north and south Poland. Transmission capacity expansion is highest between France and Germany, and Germany and Poland. In sum, renewable and nuclear generation, as well as storage and transmission improve the aim of maximizing renewable electricity integration.

Regional impacts of electricity system infrastructure

When national electricity targets are met, some NUTS-3 regions are more impacted than others as compared to the scenario with frozen generation capacity that represents 2018, as shown in Fig. 4 (see Supplementary Fig. 2 for total impacts). The scenario with minimum system costs has a high increase in system costs per capita near the coasts, such as in Weser-Ems (Germany) and West Pomerania (Poland) due to high wind speeds and land availability. Substantial decreases in system costs are in regions with currently high nuclear and fossil fuel capacities in France, Germany, and Poland. The scenario with maximum regional equality has more regionally even and less extreme increases in system costs. Regional system costs increase toward inland regions due to more onshore wind and solar PV. There are fewer regions with decreased system costs, especially in France. One exception is the region of Spree-Neisse (Germany) that decommissions coal capacities. The scenario of maximum renewable electricity generation has a relatively high increase in system costs, both near the coasts and toward the inland due to high solar PV, wind, storage, and transmission capacities. Similar to all other distinct scenarios, we find a net decrease in system costs in regions with currently high coal capacities. In contrast, there are fewer changes in system costs in regions with currently high nuclear capacities. For all distinct scenarios, we find minor changes in system costs per capita in Denmark and Switzerland.

Fig. 4: Regional impacts from generation, storage, and transmission in 2035.
figure4

The values show changes in system costs, employment, greenhouse gas (GHG) emissions, particulate matter emissions, and land use per NUTS-3 region for the four distinct scenarios of frozen generation capacity, minimum system costs, maximum regional equality of system costs, and maximum renewable electricity generation, as compared to the scenario with frozen generation capacity that represents the electricity system infrastructure from 2018. A Gini index of 1.0 indicates perfect regional inequality and a Gini index of 0.0 indicates perfect regional equality. In the scenarios of minimum system cost, maximum regional equality of system costs, and maximum renewable electricity generation, each country meets its national electricity generation targets for 2035 (see “Methods”). System costs include annual capital and variable costs (i.e., fuel, operation, and maintenance) for electricity generation, storage, and transmission. Employment impact includes annual direct employment for electricity generation and storage, including jobs in construction, installation, operation, maintenance, and decommissioning. For biomass, coal, and lignite, we additionally include jobs in fuel extraction and transport. Greenhouse gas emissions impact includes annual direct greenhouse gas emissions from fuel combustion for electricity generation. Particulate matter impact includes annual direct particulate matter emissions from fuel combustion for electricity generation. Land use impact includes direct land use for electricity generation. Source data are provided in Supplementary Data 1.

Regarding employment, the scenario with minimum system costs has the highest net increase in jobs in Austria and near the coasts of France, Germany, and Poland due to high wind capacity. The highest increase of up to 53 jobs per 1000 inhabitants is in the regions of Weser-Ems (Germany), West Pomerania (Poland), and Languedoc-Roussillon (France) as a result of high wind and solar PV capacities. The most significant net decrease in jobs is in regions with currently high nuclear and coal capacities in France, Germany, and Poland. The scenario with maximum regional equality has a more evenly distributed increase in jobs, where some regions in France, like Upper Normandy, with less jobs from decommissioned nuclear capacities have only minor net changes due to additional jobs from solar PV and wind. The scenario with maximum renewable electricity generation combines the spatial patterns from the two former scenarios. In this scenario, high increases in jobs occur near the coasts of Weser-Ems (Germany), West Pomerania (Poland), and Mecklenburg-Vorpommern (Germany), but also in inland regions of Salzburg (Austria) and Thuringia (Germany). We find a lower decrease in jobs in regions with currently high employment in coal-based generation due to additional employment in solar PV and wind generation. For example, the coal region of Piotrków County (Poland) has no net job losses for the scenario with maximum renewable electricity generation, as compared to ten lost jobs per 1000 inhabitants in the scenarios with minimum system costs and maximum regional equality.

For direct greenhouse gas and particulate matter emissions from electricity generation as well as land use, we observe similar patterns across all scenarios. The scenarios with minimum system costs, maximum regional equality, and maximum renewable electricity generation that all achieve national electricity targets for 2035 have decreases in both types of emissions in regions with currently high coal-based generation, especially in Spree-Neisse (Germany), Radomski and Sosnowiecki (Poland). Some regions have increased emissions, such as Neuss and Görlitz (Germany), due to higher gas-based electricity generation. For this reason, the scenario with maximum regional equality has a slight increase in emissions in Bouches-du-Rhône (France) and Zurich (Switzerland). The scenario of maximum renewable electricity generation has the most substantial decrease in emissions and most regions are benefitting from these impacts. Regarding the land use for electricity generation, we find an increase for most regions and all distinct scenarios that achieve national electricity targets. This is due to higher onshore wind, open-field solar PV, biogas, and woody biomass capacities. The scenario with minimum system costs has increased land use near the coasts of Denmark, Germany, and Poland, at the borders of Germany and Poland, in east Austria and south France. In comparison, the scenario with maximum regional equality has even higher land use due to higher renewable generation, especially in Weser-Ems (Germany), which amounts to 0.65% of total regional land. The scenario with maximum renewable electricity generation has similarly high land use, but it has fewer regions with severe increase as the land use is more regionally even. Only some coal regions in Germany and Poland have a net decrease for all distinct scenarios, including Spree-Neisse and Saalekreis (Germany) and Koniński (Poland).

Regional equality and trade-offs

When analyzing all 100 MGA scenarios, we find a significant trade-off between minimizing total system costs, maximizing regional equality of system costs, and maximizing renewable electricity generation (Fig. 5). These three aims thus cannot be optimized simultaneously. Compared to the scenario with minimum system costs, the scenario with maximum regional equality has 18% higher regional equality of system costs per capita (52% compared to 44%) and 4% higher renewable electricity generation (928 TWh year−1 compared to 892 TWh year−1). As a trade-off, it has 6% higher total system costs (132 billion EUR year−1 compared to 125 billion EUR year−1). Thus, regional equality improves renewable electricity integration, but decreases cost efficiency. Compared to the scenario with maximum regional equality, the scenario with maximum renewable electricity generation has 12% higher renewable electricity generation (1037 TWh year−1 compared to 928 TWh year−1), but it also has 2% higher total system costs (134 billion EUR year−1 compared to 132 billion EUR year−1) and 8% lower regional equality of system costs (48% compared to 52%). Therefore, renewable electricity generation leads to medium regional equality due to spatial constraints of allocating renewable generation capacities, and relatively lower cost efficiency due to high investment needs in renewable generation and storage capacities.

Fig. 5: Trade-off between total system costs and regional equality in 2035.
figure5

Values show total system costs and regional equality of system costs per capita for the scenario of frozen generation capacity and 100 modeling to generate alternatives (MGA) scenarios. Amongst the 100 MGA scenarios, we highlight the scenarios of minimum system costs, maximum regional equality of system costs, and maximum renewable electricity generation. Percentage values on the second y-axis are relative to the scenario of frozen generation capacity. a Colors represent the trade-off with the extent of renewable electricity generation. b Colors represent the trade-off with additionally required storage capacity, where the cut-off value of 23 GW additional capacity was selected for visual purposes. MGA scenarios are generated with a slack of 20% above total levelized electricity generation costs of the cost-optimal solution in EXPANSE and assuming that each country meets its national electricity generation targets for 2035 (see “Methods”). Source data are provided in Supplementary Data 1.

The trade-offs between total system costs, regional equality of system costs, renewable electricity generation, and the four other regional impacts are shown in Fig. 6. Compared to the scenario with minimum system costs, the scenario with maximum regional equality has 14% lower greenhouse gas emissions, 8% lower particulate matter emissions, 11% higher land use, and 1% lower employment. Compared to the scenario with maximum regional equality, the scenario with maximum renewable electricity generation has 45% lower greenhouse gas emissions, 29% lower particulate matter emissions, similar land use, and 8% higher employment. These results suggest that some aims improve only certain regional impacts. Compared to all MGA scenarios, the aim of minimizing total system costs enables relatively lower land use, but also lower employment, as well as higher greenhouse gas and particulate matter emissions. By this comparison, the aim of maximizing regional equality of system costs means medium levels of greenhouse gas and particulate matter emissions, but higher land use and lower employment. The aim of maximizing renewable electricity generation encourages higher employment, and lower greenhouse gas and particulate matter emissions, but also higher land use.

Fig. 6: Costs, regional equality, renewable electricity generation, and impacts in 2035.

Trade-off between regional impacts and total system costs, regional equality of system costs per capita, and renewable electricity generation. Regional impacts include employment, greenhouse gas and particulate matter emissions, and land use. Gray scatter points depict the 100 MGA scenarios. We additionally highlight the four distinct scenarios of frozen generation capacity, minimum system costs, maximum regional equality of system costs, and maximum renewable electricity generation. Percentage values on the second y-axis are relative to the frozen generation scenario. MGA scenarios are generated with a slack of 20% above total levelized electricity generation costs of the cost-optimal solution in EXPANSE model and assuming that each country meets its national electricity generation targets for 2035 (see “Methods”). Source data are provided in Supplementary Data 1.

We also evaluate how even all these impacts are distributed across the sub-national regions (Fig. 7), which we measure with the Gini index (see “Methods”). Regarding system costs per capita, the scenario with frozen generation capacity has the least even distribution of system costs. Amongst all 100 MGA scenarios that reach national electricity targets, the scenario with minimum system costs has a rather uneven distribution of system costs. In contrast, the scenario with maximum regional equality has the most even distribution, whereas the scenario with maximum renewable electricity generation has above-average equality too. Regarding employment, the scenario with frozen generation capacity has the most uneven regional distribution of jobs per 1000 inhabitants and this is improved in the scenarios with minimum system costs or especially maximum regional equality. The scenario with maximum renewable electricity generation has an above-average equality in terms of employment impacts too. Overall, employment impacts are more unevenly distributed across regions compared to system costs, because technology-specific generation costs (main component of system costs) vary less than jobs. For example, levelized electricity generation costs of wind and solar PV in 2035 are similar to those of fossil fuels, but the associated jobs per MWh are up to five times lower. Therefore, regional differences in electricity generation lead to more extreme regional differences in jobs than in system costs.

Fig. 7: Gini index of regional impacts.
figure7

Box plots (in gray) show the Gini index for the spatial distribution of regional impacts on system costs, employment, greenhouse gas emissions, particulate matter emissions, and land use for 100 modeling to generate alternatives (MGA) scenarios. In addition, we highlight the Gini index of regional impacts for the four distinct scenarios of frozen generation capacity, minimum system costs, maximum regional equality of system costs, and maximum renewable electricity generation. A Gini index of 1.0 indicates perfect regional inequality and a Gini index of 0.0 indicates perfect regional equality. Box plot elements: center line, median; box limits, upper and lower quartiles; whiskers, minimum and maximum values. MGA scenarios are generated with a slack of 20% above total levelized electricity generation costs of the cost-optimal solution in EXPANSE and assuming that each country meets its national electricity generation targets for 2035 (see “Methods”). Source data are provided in Supplementary Data 1.

Regarding environmental impacts, greenhouse gas emissions are much more unevenly distributed across regions. The scenario with frozen generation capacity has a medium even distribution of greenhouse gas emissions and the scenario with minimum system costs is less even due to a substantial decrease of emissions in some regions and minor changes in others. The greenhouse gas emissions are lower and slightly more evenly distributed for the scenarios with maximum regional equality and maximum renewable electricity generation. Particulate matter emissions for all MGA scenarios are lower and more evenly distributed than for the scenario with frozen generation capacity due to decreased emissions in coal regions. The scenario with minimum system costs has an uneven distribution due to high emissions in few coal regions. The scenarios with maximum regional equality and maximum renewable electricity generation have a more even distribution of low particulate matter emissions. Regarding land use, the scenario with frozen generation capacity has the most uneven distribution and land use for all MGA scenarios that achieve country targets is higher, yet more evenly distributed. The scenario with minimum system costs has a relatively uneven distribution, whereas the most even distribution is in the scenario with maximum renewable electricity generation, followed by the scenario with maximum regional equality. Overall, we find that maximizing regional equality of system costs and renewable electricity generation leads to rather high regional equality of employment, greenhouse gas and particulate matter emissions, and land use. Minimizing system costs leads to rather low regional equality of all impacts, although regional equality is higher than if national electricity targets are not met.

Comments

    Something to say?

    Log in or Sign up for free

    Disclaimer: The translated content is provided by third-party translation service providers, and IKCEST shall not assume any responsibility for the accuracy and legality of the content.
    Translate engine
    Article's language
    English
    中文
    Pусск
    Français
    Español
    العربية
    Português
    Kikongo
    Dutch
    kiswahili
    هَوُسَ
    IsiZulu
    Action
    Related

    Report

    Select your report category*


    Reason*


    By pressing send, your feedback will be used to improve IKCEST. Your privacy will be protected.

    Submit
    Cancel