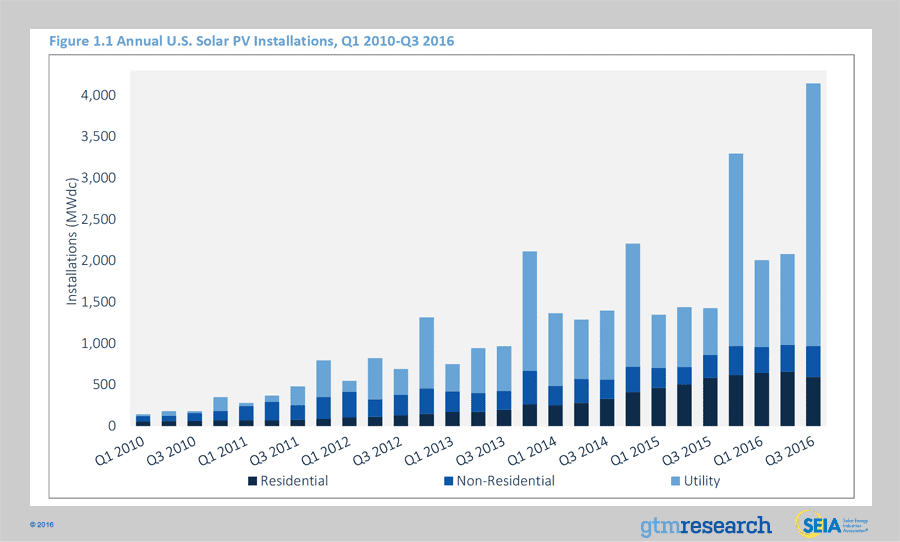
The 3rd quarter of 2016 saw more photovoltaic (PV) systems installed than any other quarter so far. According to the latest market insight report released by GTM Research and the Solar Energy Industries Association (SEIA), this year is shaping up as yet another record-breaking one in installed solar capacity after a good 2015.
According to the latest figures, some 4,143 MW of solar PV were installed in the U.S. during Q3’16, marking a 99% increase over Q2’16 and a 191% rise over Q3’15. One megawatt of photovoltaic power came online every 34 minutes in Q3’2016, which is enough to power 164 American homes on average.
There’s great optimism for the current quarter as well. Despite no official figures have been released, the report’s authors claim Q4’16 is expected to greatly surpass Q3’2016. Over a million solar systems are operational in the country as of May 2016.
“Coming off our largest quarter ever and with an extremely impressive pipeline ahead, it’s safe to say the state of the solar industry here in America is strong,” said Tom Kimbis, SEIA’s interim president, in a statement to the press. “The solar market now enjoys an economically winning hand that pays off both financially and environmentally, and American taxpayers have noticed. With a 90 percent favorability rating and 209,000-plus jobs, the U.S. solar industry has proven that when you combine smart policies with smart 21st-century technology, consumers and businesses both benefit.”
Subscribe to our newsletter and receive our new book for FREE
Join 50,000+ subscribers vaccinated against pseudoscience
By subscribing you agree to our
Privacy Policy. Give it a try, you can unsubscribe anytime.
The unprecedented growth of the U.S. solar industry was primarily sustained by utility-scale installation, which represented 77% of all the solar power installed in the third quarter. Just so you can get a sense of what’s to come in Q4, 4.8 GW worth of utility-scale projects will come online by the end of this year. That’s more than all the utility PV installed in 2015.
Q2 2016 Solar Market Update: Key Takeaways
Over 4 GW installed in 1H 2016
45% growth in Photovoltaic (PV) market over 1H 2015
Q2 2016 was largest non Q4 ever
Nearly 32 GW of total solar capacity now installed
CAGR of 58% since 2010
Generates enough electricity to power 6.2 million homes
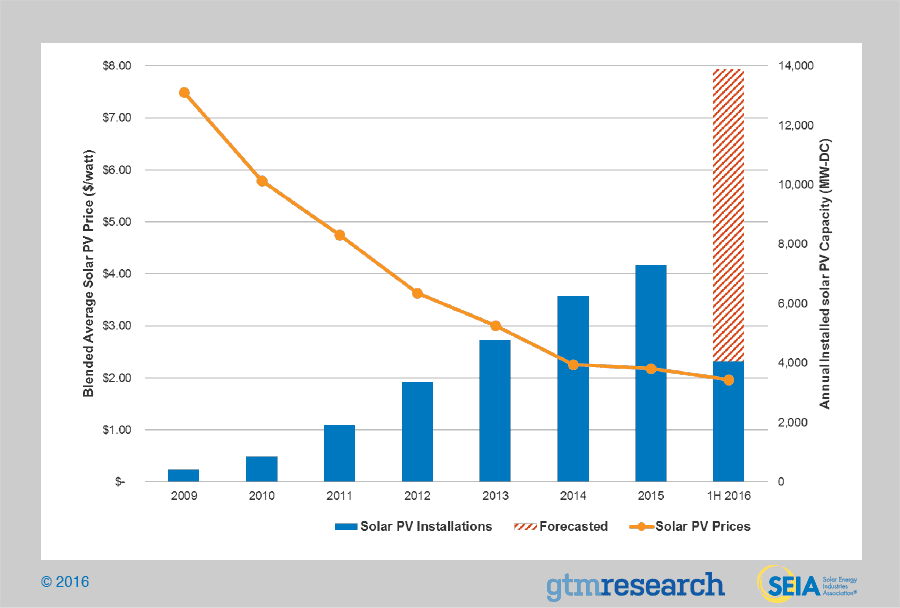
Solar prices dropped 18% from Q2 2015 to Q2 2016
Price drop is seen across all market segments
Prices have dropped 63% since 2011
Utility-Scale PPAs now signed for $0.03 – $0.05/kWh
Through Q2 2016, Solar represents 26% of all newly installed electric capacity
With big 2H 2016 expected, could end year ahead of Wind, NG
In Q1 2016, hit 1 million solar installations
Will hit 2 million installs in just 2 years
Residential solar installations or rooftop solar actually experienced a slowdown in growth compared to previous quarters. Residential solar is down 10 percent compared to Q2’2016 and, overall, this sector experienced only 2% year-to-year growth. Nevertheless, more than half-a-gigawatt of residential PV was installed in Q3.
The massive deployment of utility-scale solar can be pinned to anxiety and uncertainty over the expiration of tax credits. Congress, however, extended these until 2019. Maybe 2017 might not be so good as 2016 but the next two years will see a lot of growth for solar.
The cost to install solar has dropped by more than 60% over the last 10 years.
The bad news is that post-2019 things look murky. It doesn’t seem probable that tax credits that incentives solar use will be extended by the new administration. On the other hand, solar energy might become so cheap by then that it doesn’t really matter what the government has to say. Market forces will sustain the momentum. In places in the U.S., solar energy is cheaper than fossil fuels even without subsidies.
Original Text (This is the original text for your reference.)
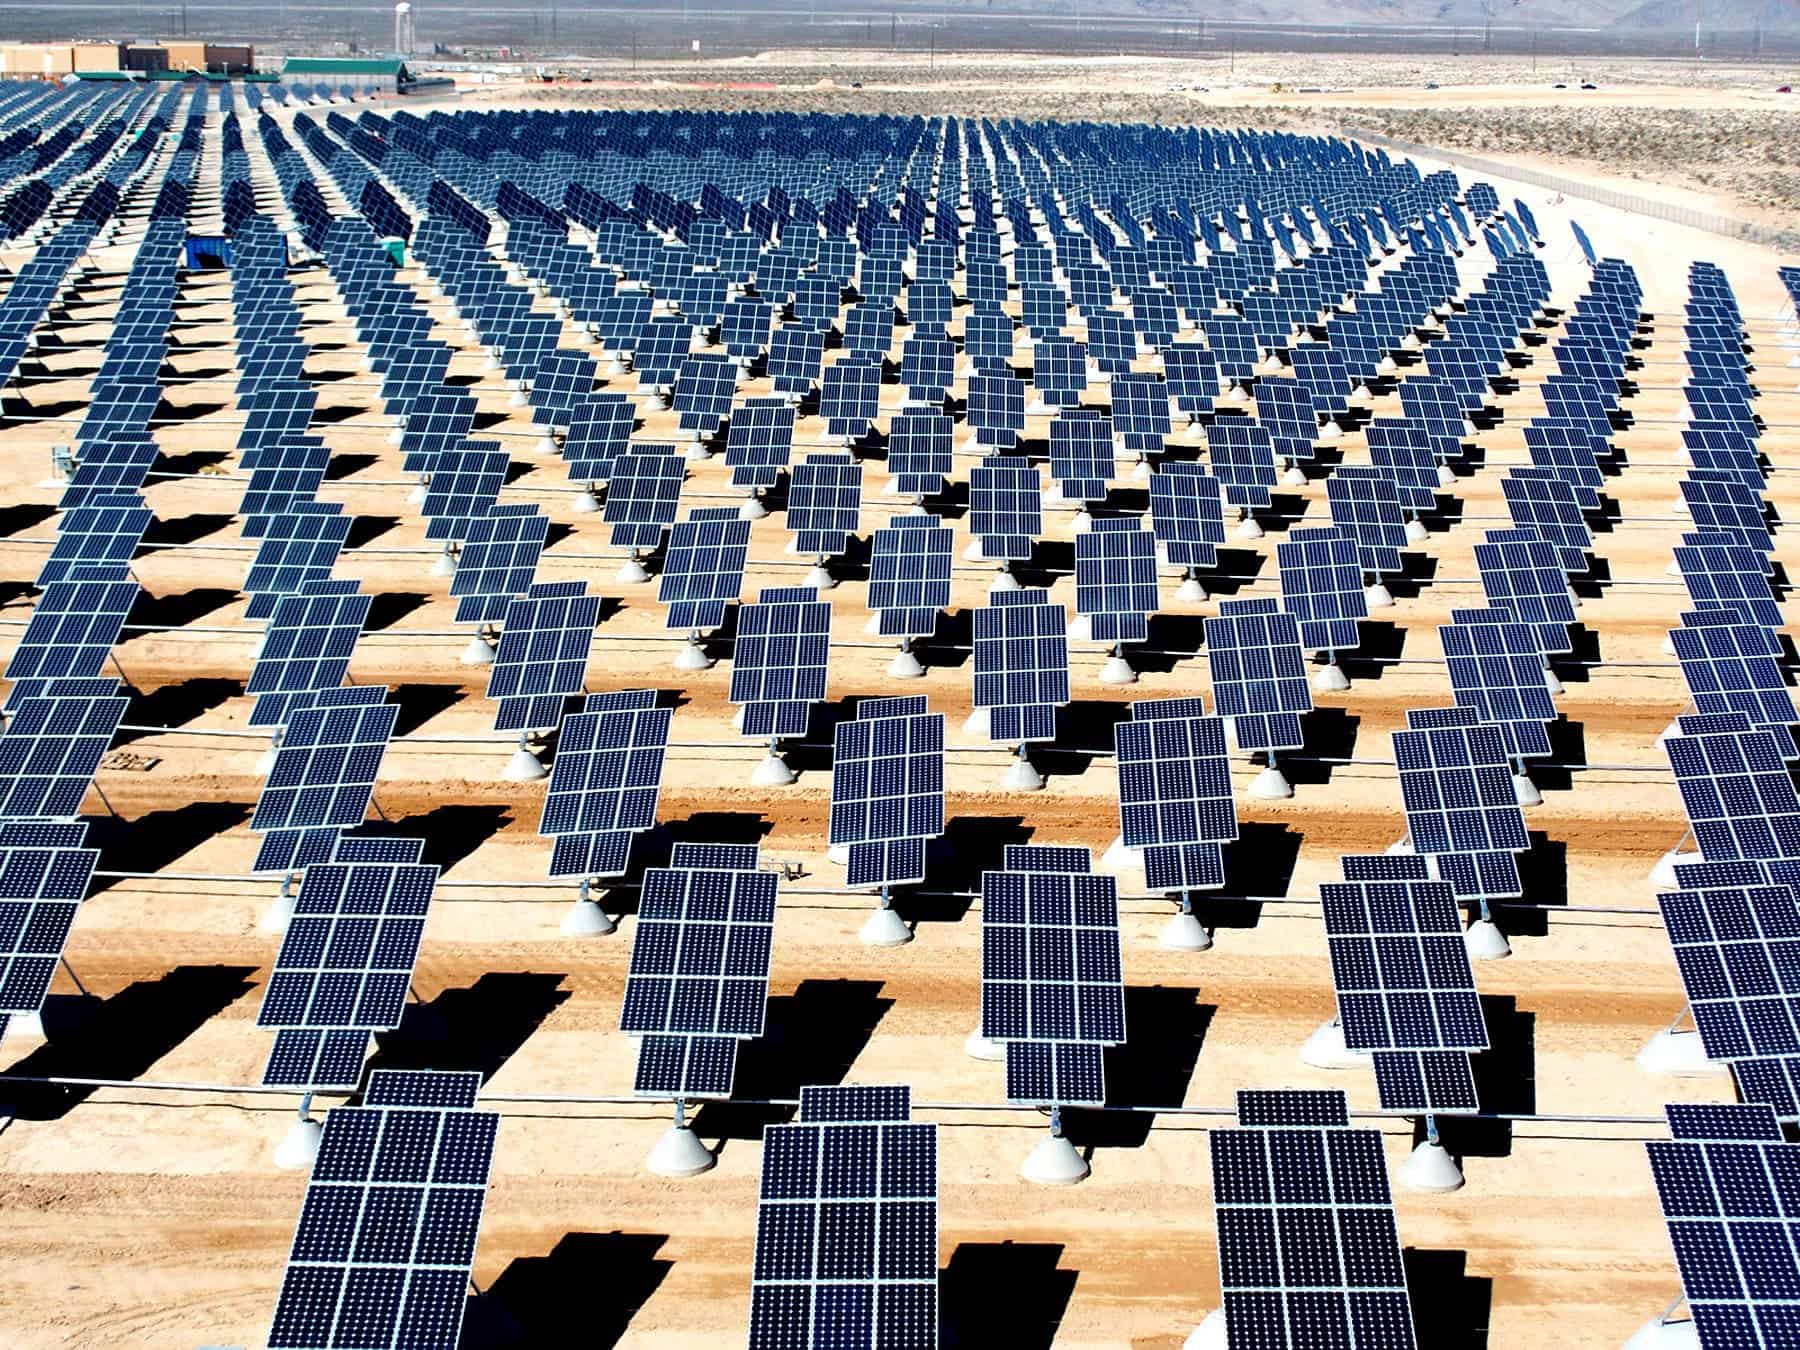
Credit: Wikimedia Commons
The 3rd quarter of 2016 saw more photovoltaic (PV) systems installed than any other quarter so far. According to the latest market insight report released by GTM Research and the Solar Energy Industries Association (SEIA), this year is shaping up as yet another record-breaking one in installed solar capacity after a good 2015.
According to the latest figures, some 4,143 MW of solar PV were installed in the U.S. during Q3’16, marking a 99% increase over Q2’16 and a 191% rise over Q3’15. One megawatt of photovoltaic power came online every 34 minutes in Q3’2016, which is enough to power 164 American homes on average.
There’s great optimism for the current quarter as well. Despite no official figures have been released, the report’s authors claim Q4’16 is expected to greatly surpass Q3’2016. Over a million solar systems are operational in the country as of May 2016.
“Coming off our largest quarter ever and with an extremely impressive pipeline ahead, it’s safe to say the state of the solar industry here in America is strong,” said Tom Kimbis, SEIA’s interim president, in a statement to the press. “The solar market now enjoys an economically winning hand that pays off both financially and environmentally, and American taxpayers have noticed. With a 90 percent favorability rating and 209,000-plus jobs, the U.S. solar industry has proven that when you combine smart policies with smart 21st-century technology, consumers and businesses both benefit.”
Subscribe to our newsletter and receive our new book for FREE
Join 50,000+ subscribers vaccinated against pseudoscience
By subscribing you agree to our
Privacy Policy. Give it a try, you can unsubscribe anytime.
The unprecedented growth of the U.S. solar industry was primarily sustained by utility-scale installation, which represented 77% of all the solar power installed in the third quarter. Just so you can get a sense of what’s to come in Q4, 4.8 GW worth of utility-scale projects will come online by the end of this year. That’s more than all the utility PV installed in 2015.
Q2 2016 Solar Market Update: Key Takeaways
Over 4 GW installed in 1H 2016
45% growth in Photovoltaic (PV) market over 1H 2015
Q2 2016 was largest non Q4 ever
Nearly 32 GW of total solar capacity now installed
CAGR of 58% since 2010
Generates enough electricity to power 6.2 million homes
Solar prices dropped 18% from Q2 2015 to Q2 2016
Price drop is seen across all market segments
Prices have dropped 63% since 2011
Utility-Scale PPAs now signed for $0.03 – $0.05/kWh
Through Q2 2016, Solar represents 26% of all newly installed electric capacity
With big 2H 2016 expected, could end year ahead of Wind, NG
In Q1 2016, hit 1 million solar installations
Will hit 2 million installs in just 2 years
Residential solar installations or rooftop solar actually experienced a slowdown in growth compared to previous quarters. Residential solar is down 10 percent compared to Q2’2016 and, overall, this sector experienced only 2% year-to-year growth. Nevertheless, more than half-a-gigawatt of residential PV was installed in Q3.
The massive deployment of utility-scale solar can be pinned to anxiety and uncertainty over the expiration of tax credits. Congress, however, extended these until 2019. Maybe 2017 might not be so good as 2016 but the next two years will see a lot of growth for solar.
The cost to install solar has dropped by more than 60% over the last 10 years.
The bad news is that post-2019 things look murky. It doesn’t seem probable that tax credits that incentives solar use will be extended by the new administration. On the other hand, solar energy might become so cheap by then that it doesn’t really matter what the government has to say. Market forces will sustain the momentum. In places in the U.S., solar energy is cheaper than fossil fuels even without subsidies.
Disclaimer: The translated content is provided by third-party translation service providers, and IKCEST shall not assume any responsibility for the accuracy and legality of the content.


 User Center
 My Training Class
 Feedback


Comments
Something to say?
Log in or Sign up for free