Language
We detect your regional language is French. Do you want to change site's language to French? You may choose other languages.International
 English
 中文
中文
 русск
русск
 français
 español
 العربية


 User Center
 My Training Class
 Feedback


Knowledge application (知识应用)
Column of “COVID-19 Prevention and Control”(疫情防控专栏)
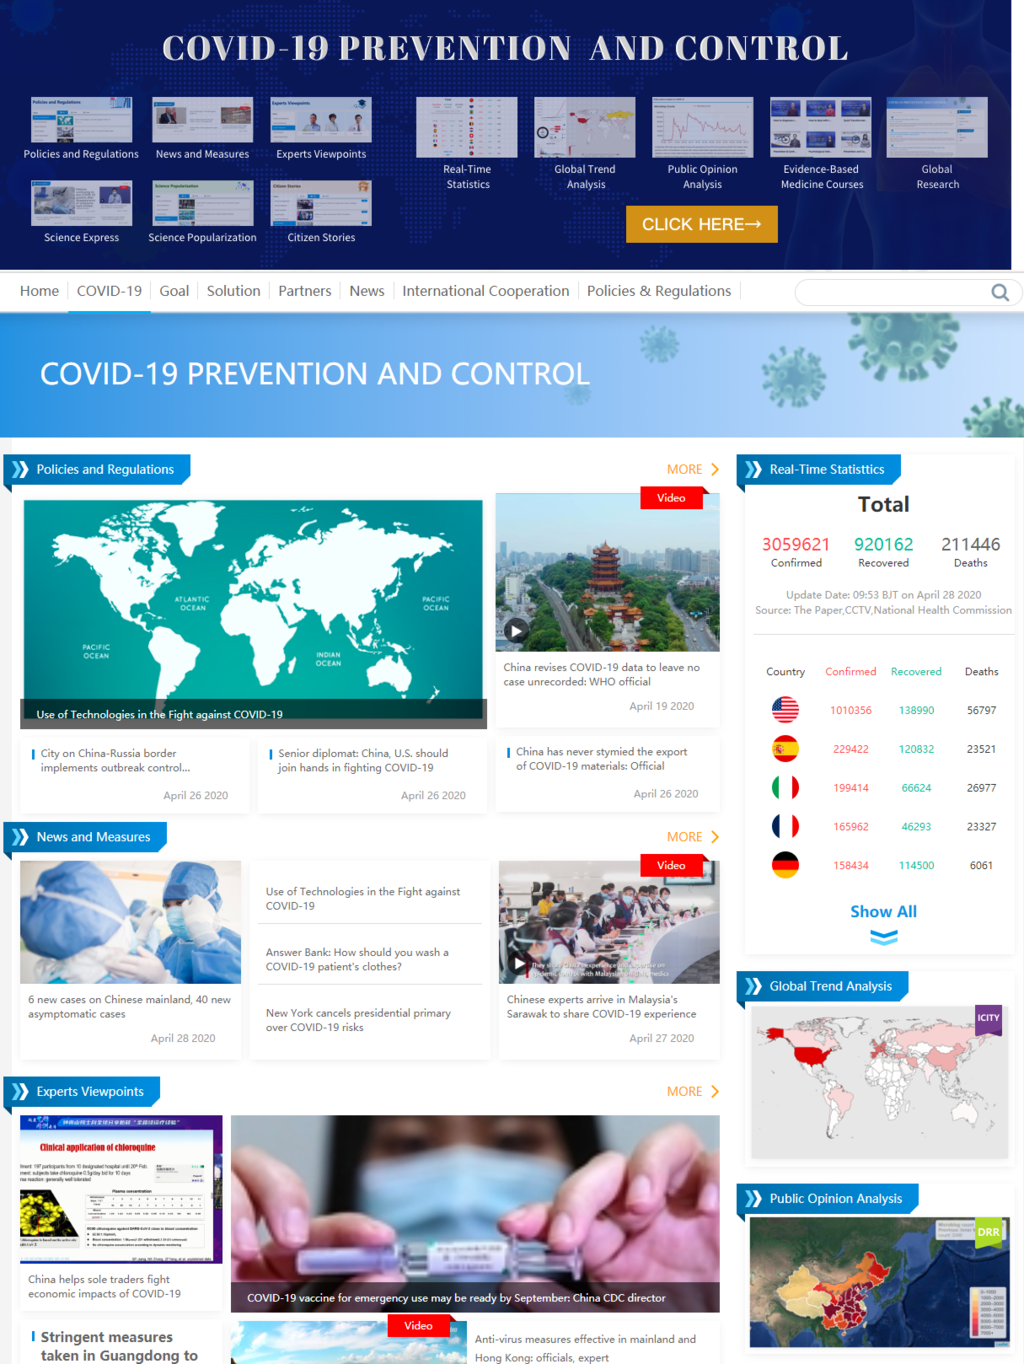
Introduction: The column COVID-19 Prevention and Control was officially launched on February 14, 2020. Until now, the version 4.0 has been updated and released. The column is comprehensive and distinctive in its content, aiming to share relevant information (from all over the world) and experience from various countries, especially that from China.
This column focuses on information in terms of six aspects, namely Policy and Regulations, News and Measures, Experts Viewpoints, Science Express, Science Popularization, and Citizen Stories, sharing with the world in real time the epidemic information, research progress, as well as prevention and control measures and experience.
This column displays global cumulative curves of confirmed cases, deaths, recoveries and the growth rate of these numbers over time, and provides real-time data of cure rate and mortality. This column also provides recorded courses presented by leading medical professionals and scholars in China, as well as resources from Evidence-based Medicine (EBM) databases. A total of 25 courses, over 3,000 EBM topics, and thousands of research papers on COVID-19 can be accessed by the public for free.
This column also analyses public opinion by integrating the social media analytics and GIS methods. The temporal and spatial changes of epidemic-related weibo (Chinese Twitter) tweets, as well as the main topics discussed by the public, are retrieved and shown in the online maps, providing support for government emergency management decision-making.
Source: IKCEST General Platform
Release date: Apr, 2020
Provided by: Cai Lingli,Zhang Xinxing
Video (视频课件)
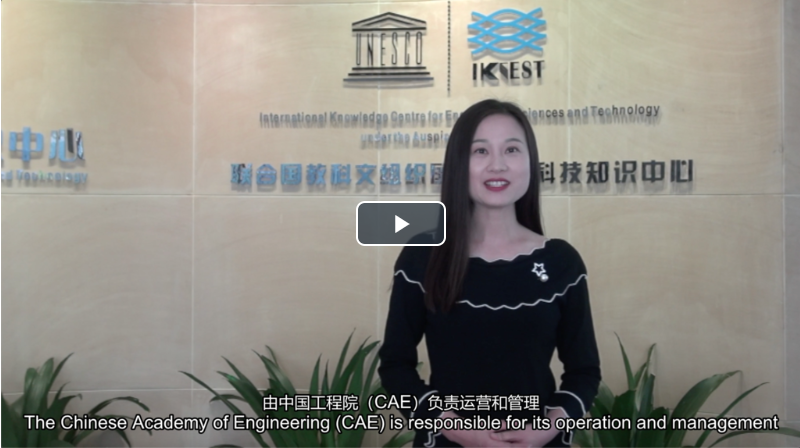
UNESCO's Official Website Releases an Introduction Video of the IKCEST’s Column of COVID-19 Prevention and Control(国际工程科技知识中心“COVID-19疫情防控专栏”宣传视频被联合国教科文组织官网发布)
Introduction: Since the COVID-19 Prevention and Control column of IKCEST was launched, its content has been upgraded and iterated continuously. The UNESCO headquarters and its Beijing Cluster Office have given close attention and recognition to this column. The UNESCO headquarters has invited IKCEST to make a video to introduce its related work. At present, the introduction video of the column is displayed on UNESCO’s official website and uploaded to YouTube by UNESCO.
Source: IKCEST General Platform
Release date: Apr, 2020
Provided by: Cai Lingli,Zhang Xinxing
Scientific Data (科学数据)
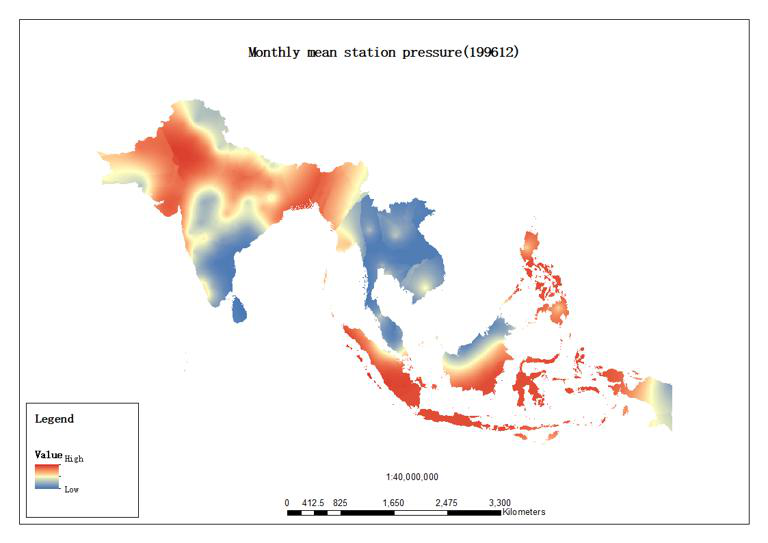
Monthly total precipitation monitoring data set for South Asia and southeast Asia(1989-2018)(1989-2018年南亚和东南亚月降水总量监测数据集)
Introduction: The data set is calculated and interpolated by weather station data. The meteorological site data comes from NOAA, which includes data such as temperature, wind speed, and precipitation. The research team processes the daily weather station data into monthly data, and then interpolates through Kriging to form raster data covering the entire study area.
Source: Disaster Risk Reduction Knowledge Service
Release date: Sep, 2019
Provided by: Yuan Yuelei
Weibo sentiment index dataset related to the flood in Shouguang, China (2018)(中国寿光水灾微博情绪指数数据集(2018年))
Introduction: This dataset is Weibo Sentiment Index Data related to the Flood in Shouguang, China. Original Weibo messages were collected with “Shouguang” as the keyword by using web crawlers and Weibo API. The following information was extracted: user ID, timestamp (i.e., the time when the message was posted), text (i.e., the text message posted by a user), and location information. Then sentiment index was calculated by ‘Tencent’ natural language processing (NLP) API. The data format is Excel. The spatial scope is China. The temporal range is 00:00 on August 19 2018 and 00:00 on August 28 2018. There are 77,581 Weibo texts.
Source: Disaster Risk Reduction Knowledge Service
Release date: Sep, 2019
Provided by: Yuan Yuelei
Knowledge application (知识应用)
Knowledge Service of Annual Spatial Distribution Data Service for Drought Monitoring in Mongolian Plateau (1981-2012)(蒙古高原干旱监测逐年空间分布数据服务知识应用)
Introduction: The vegetation degradation, drought and other environmental issues in the Mongolian Plateau have been as the hot spot in the study of the climate change and the ecological environment changes in Northeast Asia. However, it is lack of study focused on building the stable drought monitoring model and their spatio-temporal differences between Mongolia and Inner Mongolia. Based on the NOAA AVHRR NDVI-Path Finder 10d remote sensing data of 1981-1999 and MODIS vegetation index and the surface temperature 16d data of 2000-2012, the knowledge service inverted Temperature and Drought Vegetation Index (TVDI) by the Ts-NDVI general space, their spatio-temporal distribution and changes were studied. The main conclusions are as follows: The inverted TVDI based on NOAA AVHRR NDVI-Path Finder and MODIS data, could explain the macro spatio-temporal distribution and changes of drought. The vegetation cover and drought in the Mongolian Plateau has obvious zonal distribution, and closely related with the Land Use/Land cover types. Drought is common in the Mongolian Plateau, and it is severe drought in some years. There were differences between the changes of TVDI in different regions of different Land Use/Land Cover.
Source: Disaster Risk Reduction Knowledge Service
Release date: 2018
Provided by: Yuan Yuelei
Video (视频课件)
Paradigm shifts in Climate Data Management(气候数据管理的范式转换)
Introduction: Tens of petabytes of climate observation and simulation data have been accumulated over the last 40 years. The ground segment systems have exhibited three paradigm shifts. Data discovery, data access, and multi institution collaboration are the major characteristics. The report presents the underlying technical details about each paradigm, and highlights the exemplar case studies. The purpose of the report is revealing the overall trend of managing large scale climate observation and simulation data, its challenges and opportunities.
Source: Disaster Risk Reduction Knowledge Service
Release date: Oct, 2019
Provided by: Yuan Yuelei

Scientific Data (科学数据)
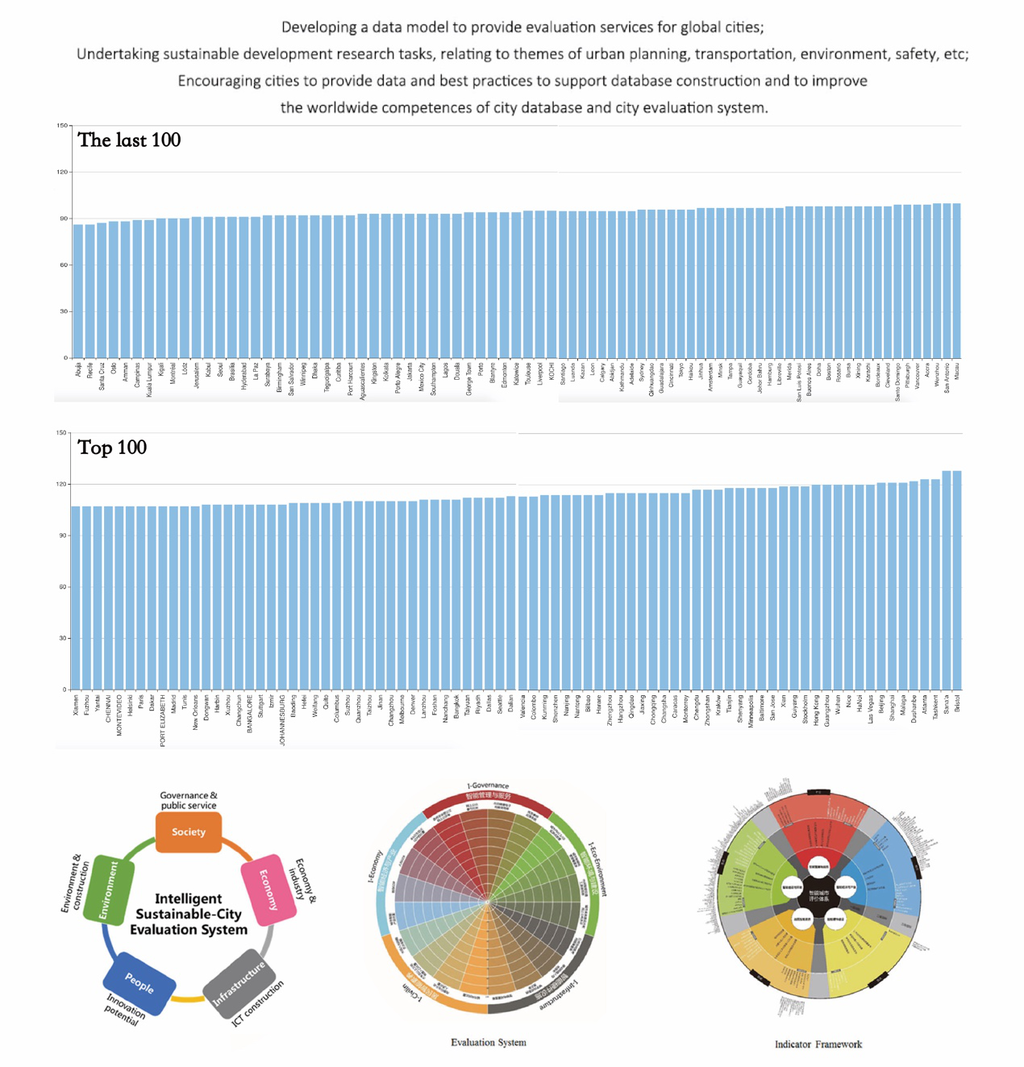
Latest Global CityIQ Ranking(最新全球城市IQ排名)
Introduction: Developing a data model to provide evaluation services for global cities; Undertaking sustainable development research tasks, relating to themes of urban planing, transportaion, environment, safety. etc; Encouraging cities to provide data and best practices to support database construction and to improve the worldwide competences of city database and city evaluation system.
Source: Intelligent City Knowledge Service
Release date: Apr, 2020
Provided by: Cao Buyang
Knowledge application (知识应用)
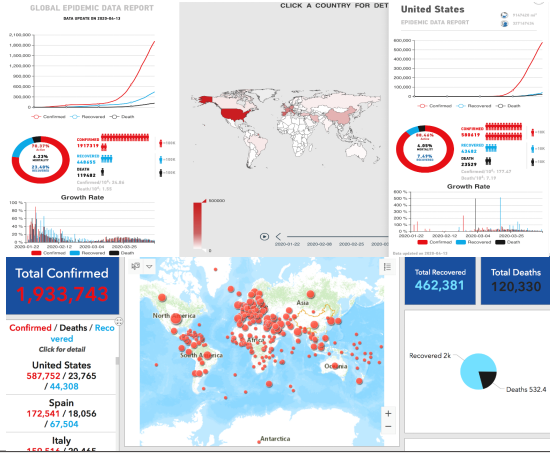
Global COVID-19 Data and Research (全球COVID-19新冠疫情数据与研究)
Introduction: In the circumstance of the novel coronavirus epidemic spreading all over the world, iCity launched a new column on global COVID-19 research in March, 2020. Collecting data from National Health Commission of China, WHO and other world authoritative organizations, scientific research institutions and state official media, combining closely with the GIS technology platform, iCity releases real-time global epidemic data and dynamically displays them on an interactive world map. The column visualizes global and country data on intuitive graphs. The cumulative curves and histogram of growth ratio of confirmed cases, death toll and recovered numbers, even the recovery rate and mortality can be seen by one click. iCity provides package of comprehensive, scientific and authoritative global research data of COVID-19.
Source: Intelligent City Knowledge Service
Release date: Apr, 2020
Provided by: CAO Buyang
Video (视频课件)
Urban Recent Construction Planning (城市近期建设规划)
Introduction: Peng Zhenwei, Professor and Doctoral Supervisor of College of Architecture and Urban Planning, Tongji University, currently Secretary of the Party Committee of School of Architecture and Urban Planning, Tongji university.
Source: Intelligent City Knowledge Service
Release date: Feb, 2020
Provided by: LI Xiang
Textual Example And Sentence Characteristics of Master Plan (总体规划的文本体例和句式特点)
Introduction: Wang Xinzhe, Vice president of Shanghai Tongji Urban Planning and Design Institute; member of the Academic Committee of Master Planning of China Urban Planning Society.
Source: Intelligent City Knowledge Service
Release date: Feb, 2020
Provided by: LI Xiang
Spatial Management Planning of Urban Area And Central Urban Area (城市区及中心城区空间管理规划)
Introduction: Zhuo Jian, Department of Urban Planning, Tongji university, Associate Dean, Vice Chairman of the Department of Transportation, China Urban Science Research Association editorial board member.
Source: Intelligent City Knowledge Service
Release date: Feb, 2020
Provided by: LI Xiang

Scientific Data (科学数据)
World Development Indicators-China(世界发展指标-中国)
Introduction: The world development indicator consists of 55 data items from China spanning 50 years (1968-2017), with visualizations of the data including straight lines, bars, scatter points and pie charts of the indicators. Provides all the generated display export functions. Download includes Chinese, English, Russian and Arabic. Source: Silk Road Sciences and Technology Knowledge Service
Source: Silk Road Sciences and Technology Knowledge Service
Release date: Apr, 2020
Provided by: Dong Yang

Knowledge application (知识应用)
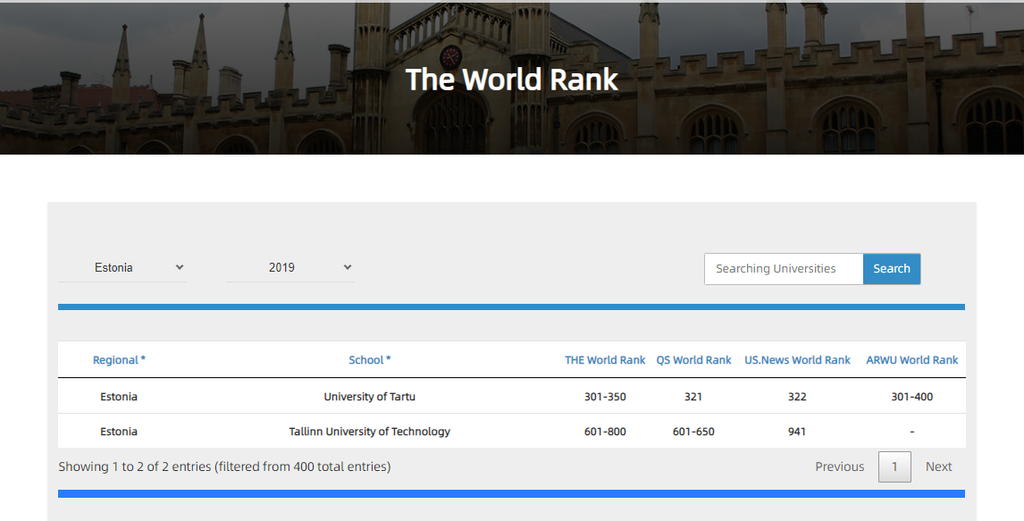
The World Rank of Estonia University(“一带一路”高校排名-爱沙尼亚)
Introduction: A knowledge application for comprehensive display and inquiry of Estonia University is built to comprehensively display four internationally recognized world university rankings, such as QS, THE, US News and soft science world university rankings, so as to facilitate engineering and scientific personnel from countries along the " Belt And Road" to recruit students and choose schools in countries along the " Belt And Road".
Source: Silk Road Sciences and Technology Knowledge Service
Release date: Apr, 2020
Provided by: Zhang Qianglong
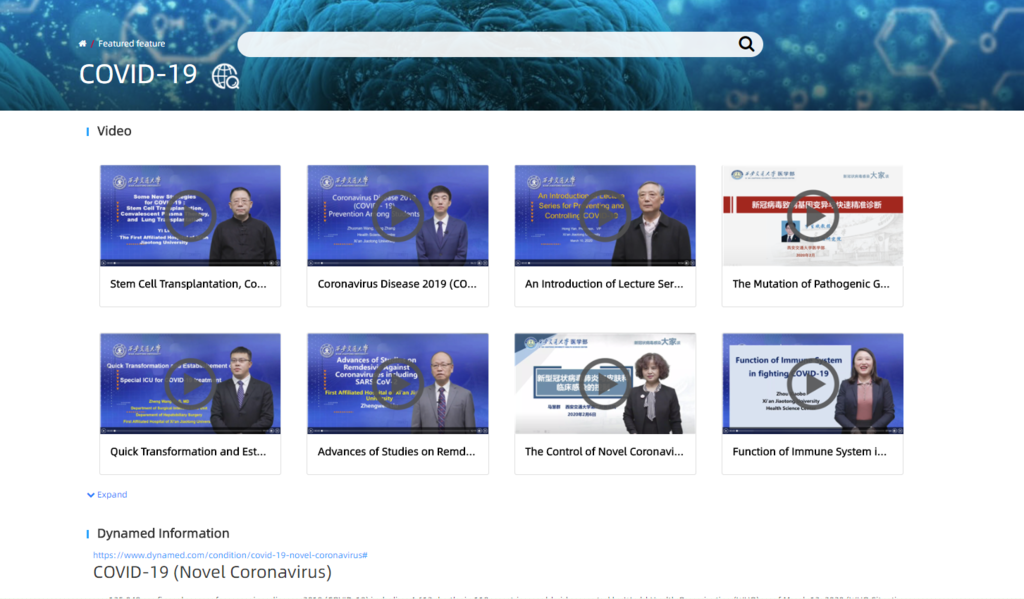
COVID-19 Evidence-Based Medicine database and courses (COVID-19循证医学数据库和课程服务)
Introduction: This column also provides recorded courses presented by leading medical professionals and scholars in China, as well as resources from Evidence-based Medicine (EBM) databases. A total of 25 courses, over 3,000 EBM topics, and thousands of research papers on COVID-19 can be accessed by the public for free.
Source: Silk Road Sciences and Technology Knowledge Service
Release date: Mar, 2020
Provided by: Zhu Ying
Video (视频课件)
Computer security(计算机安全)
Introduction: This course covers the fundamental concepts underlying the construction of secure systems, from the hardware to the software to the human-computer interface, with the use of cryptography to secure interactions. These concepts are illustrated with examples drawn from modern practice, and augmented with hands-on exercises involving relevant tools and techniques. Successful participants will develop a way of thinking that is security-oriented, better understanding how to think about adversaries and how to build systems that defend against them.
Source: Silk Road Sciences and Technology Knowledge Service
Release date: Mar, 2020
Provided by: Liu Jun

>>>IKCEST Newsletter 2020 February<<<
>>>IKCEST Newsletter 2019 December<<<