To address with the overall requirements of IKCEST and user requirements, the DRRKS upgraded the interface design, functional interfaces, and technical tools of the website portal in a small scale. The functional module interface style was modified to optimize the user access experience of the platform. The new feature was released at the end of March 2019.
DRRKS upgraded the “Global Earthquake Daily Distribution Map Service” module. The visualization application of global seismic location distribution on homepage is an online application based on WebGIS development that invokes the seismic data interface issued by the United States Geological Survey, USGS. The original source position label was modified to dots of different colors to distinguish the difference in magnitude. This small change will make it easy for users to understand where a serious earthquake occurred.
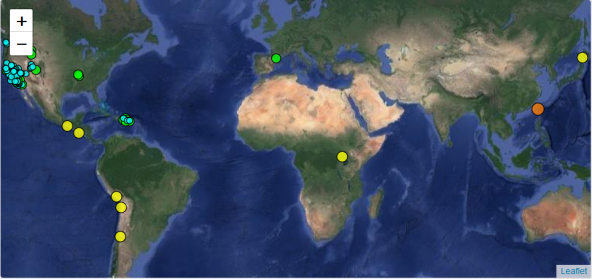
Fig 1: “Global Earthquake Daily Distribution Map Service” module
Often, the archived data are also very important, so DRRKS has recently developed the “Global Earthquake Daily Distributed Automated Mapping Tool”. A mapping script tool based on the global seismic daily distribution map service application was developed, and the daily seismic distribution in the form of pictures in the website module can be archived and published. Maps are drawn by the open source GIS tool “Basemap” which is archived by year and month. Users can choose different years and months to view the relevant earthquake distribution map; different magnitudes are displayed in different colors.
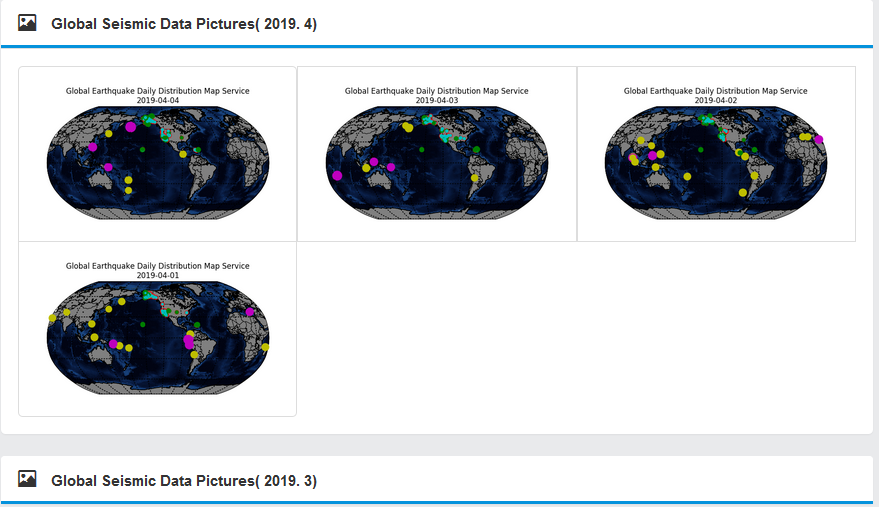
Fig 2: “Global Earthquake Daily Distribution Automated Mapping Tool”
“Newsletters” is an information push project launched by DRRKS in 2019. We have developed a separate layout for displaying archived documents. It is convenient for users to browse and view historical documents.
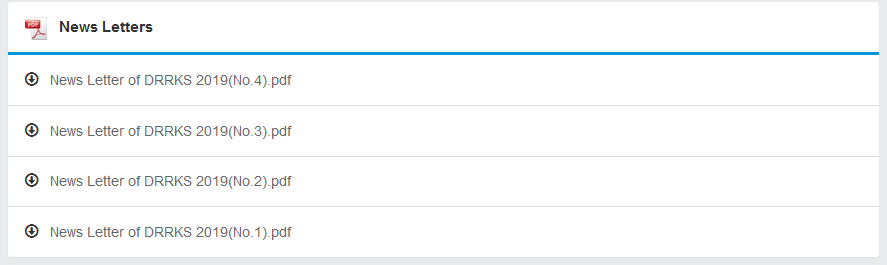
Fig 3: “Newsletters” thematic module
Provided by the IKCEST Disaster Risk Reduction Knowledge Service System
Original Text (This is the original text for your reference.)
To address with the overall requirements of IKCEST and user requirements, the DRRKS upgraded the interface design, functional interfaces, and technical tools of the website portal in a small scale. The functional module interface style was modified to optimize the user access experience of the platform. The new feature was released at the end of March 2019.
DRRKS upgraded the “Global Earthquake Daily Distribution Map Service” module. The visualization application of global seismic location distribution on homepage is an online application based on WebGIS development that invokes the seismic data interface issued by the United States Geological Survey, USGS. The original source position label was modified to dots of different colors to distinguish the difference in magnitude. This small change will make it easy for users to understand where a serious earthquake occurred.
Fig 1: “Global Earthquake Daily Distribution Map Service” module
Often, the archived data are also very important, so DRRKS has recently developed the “Global Earthquake Daily Distributed Automated Mapping Tool”. A mapping script tool based on the global seismic daily distribution map service application was developed, and the daily seismic distribution in the form of pictures in the website module can be archived and published. Maps are drawn by the open source GIS tool “Basemap” which is archived by year and month. Users can choose different years and months to view the relevant earthquake distribution map; different magnitudes are displayed in different colors.
Fig 2: “Global Earthquake Daily Distribution Automated Mapping Tool”
“Newsletters” is an information push project launched by DRRKS in 2019. We have developed a separate layout for displaying archived documents. It is convenient for users to browse and view historical documents.
Fig 3: “Newsletters” thematic module
Provided by the IKCEST Disaster Risk Reduction Knowledge Service System


 User Center
 My Training Class
 Feedback


Comments
Something to say?
Login or Sign up for free